PPS For All: Directly charging lithium-ion batteries with a USB-C PD tester

TL;DR – USB-C with PPS (Programmable Power Supply) technology is here, it’s cool, and now it’s usable on more than just the newest smartphones – it works on almost any Li-ion battery with the right USB-C tester. Check out the GitHub repo – it’s open-source!

As seen on Hackaday!

DISCLAIMER: Lithium-ion batteries can be dangerous if mishandled or abused! While much testing and development has resulted in a fairly stable implementation, this application is still an “off-label” use of a USB PD charger and USB-C tester, and therefore there is a risk of property damage, personal injury, or other unforeseen consequences if something goes wrong (and I will NOT be held responsible for that!).

Introduction

The USB PD (Power Delivery) standard has revolutionized how we charge our everyday electronic devices. While many new devices (such as smartphones) emphasize “fast charge” capability, it has required changes to both the device itself, as well as the adapters that power them.

Because power losses in the charging cable (or any other resistance) is directly related to the amount of current flowing through it, one can get more power for the same amount of current by increasing the voltage (this is how the AC power transmission lines that you see on the street and countryside work as well). The USB PD standard allows a device to request the adapter to increase its output voltage from 5 volts to a higher level, such as 9, 15, or 20 (and sometimes 12) volts.

An addition in the third version of the USB PD standard added optional PPS (Programmable Power Supply) support for the power adapter, which allows an adapter to output a wide range of voltages, rather than a fixed “menu” of 5, 9, 15, 20 (and sometimes 12) volts.

What is USB-C PPS charging?

PPS charging is a relatively new variation to the existing PD charging scheme. It allows the device being charged to actively communicate with the adapter and request a precise voltage (and current) level, increasing efficiency since DC-DC conversion efficiency drops when the difference in voltage between the input (the adapter) and output (the battery) is larger. With this bidirectional communication, it allows the adapter to share some of the regulation workload, and therefore move some of the heat-generating power conversion to the adapter, allowing the device’s battery to charge at a cooler temperature which improves its lifespan.

Direct Battery Charging

One step past normal PPS charging is direct charging, which completely offloads the power management to the adapter; the host device controls the charge process purely via software commands to the adapter. This is analogous to the DC fast charging method used in electric vehicles (EVs), which also perform all power regulation outside of the vehicle and its internal charge circuitry. Because the device no longer needs to perform its own DC-DC conversion, this skips a step in the power conversion “chain”, increasing efficiency and reducing the amount of heat dissipated in the host device (you can’t lose power on a conversion step if you never perform that step in the first place!). With this reduction in internally-generated heat, the battery can be charged at even faster rates than it could with previous charging schemes.

One barrier to the widespread adoption of direct charging is that it requires the device to explicitly support it, as it requires significant changes to how the “power path” is designed internally. It also requires the adapter to support the voltage and current levels required by the host.

Diagrams comparing normal versus direct charging schemes.

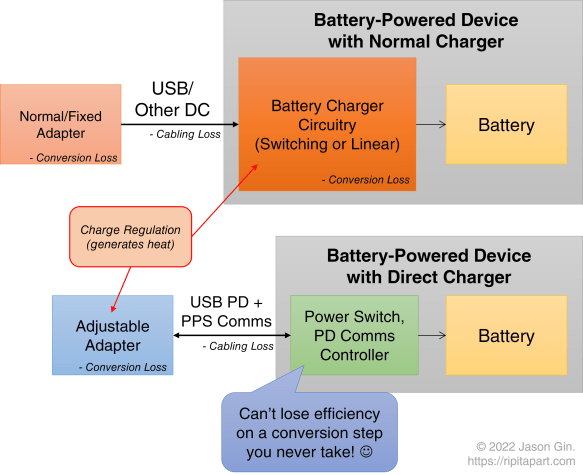
Diagrams comparing normal versus direct charging schemes. (click here for full-size image)

Thankfully, on the adapter side, PPS support is becoming more and more common, even though most devices on the market (at least at the time of writing) don’t support it. However, because that potential is already present, perhaps there’s a way for the electronics hobbyist to take advantage of direct charging for their own batteries…

Shizuku Platform and its Lua API

The Shizuku USB multimeter by YK-Lab, which is available in a few rebadged forms under names like YK-Lab YK001, AVHzY CT-3, Power-Z KT002, or ATORCH UT18, is a very useful USB charger testing device. It features USB-A and USB-C ports; can measure voltage, current, power; can calculate passed charge (mAh) and energy (mWh) in real time; but unlike most USB testers on the market, it is user-programmable in Lua, a lightweight programming/scripting language.

The Lua API on the tester provides a large amount of extensibility beyond the original tester’s design, and in my case I’m using its ability to “trigger” non-standard voltages from fast-charge capable power adapters as well as its colour LCD screen to act as a highly flexible direct charger – an intermediate between a USB-C PD PPS adapter and an arbitrary (Li-ion) rechargeable battery.

Introducing: DingoCharge!

The idea behind making a battery charging script came about when I looked at using bench-top adjustable power supplies to charge batteries. Since the Shizuku tester (in my case, it was the AVHzy CT-3 variant) allows me to use the PPS protocol to finely adjust the adapter’s output voltage, I tried manually varying the voltage to increase or decrease the current flowing into a battery – and it worked!

That said, constantly checking the battery’s current and voltage levels just to charge a battery gets pretty tiring, and since the Shizuku is Lua-programmable… why not make a script that automates all of this for me? Thus began a programming journey that’s been ongoing for over a year, and I’ve still got ideas to add even more functionality (as long as I don’t crash the tester by running out of memory… don’t ask me how I know).

Charge Regulation Algorithm

All lithium-ion batteries (including less-common ones like lithium-iron phosphate (LiFePO4) and lithium titanate) use what’s known as CC-CV charging; this stands for constant-voltage/constant-current. A fixed amount of current is fed into the battery until its voltage reaches a certain threshold, then the voltage is held at a fixed value until the current going into the battery drops below another, lower, threshold. Once this is reached, the current is turned off entirely and the charge process is complete.

Although the PPS specification allows a device to set a maximum current level, my own testing revealed that there was too much variation amongst all my different adapters that I could not rely on the hardware to perform the constant-current regulation with enough precision for my liking, and the voltage drop across the USB-C cable resulted in the battery’s charge current tapering off too early as the voltage at the adapter reached its programmed constant-voltage level before the battery’s own voltage had a chance to do so as well. Instead, my charge algorithm increases the requested USB PD charge voltage above the battery’s own voltage until the desired current level is within a certain deadband range.

Once the target constant-voltage level is reached, the charge algorithm switches to constant-voltage regulation, maintaining a preset voltage until the current being drawn by the battery falls below the termination threshold.

If a battery was previously overdischarged, it requires a slower “precharge” current to bring the battery’s voltage up to a level that is safe for its regular charge current.

Charge Safety Tests

Over time, I added more safety checks to ensure that the battery’s state was maintained within a safe margin for voltage, current, temperature, and also time. If a safety violation was detected during charging, the charging algorithm would automatically set its charge current to zero, effectively terminating the charge process. Additionally, if the charge process was finished but a small current flowing into the battery resulted in the battery’s voltage getting too high, the PD request voltage gets adjusted downwards to prevent an overvoltage condition from occurring.

Downstream Resistance Compensation

I also added the ability to compensate for high-resistance connections to the battery. This works by using Ohm’s Law (voltage = current * resistance) to boost the voltage thresholds in proportion to the amount of current flowing into the battery, as determined by a configured downstream (tester-to-battery) resistance. This is usually considered an advanced feature for a charging system, but since all of the charging is handled in software, it is relatively trivial to allow for compensating for lossy cabling and connectors.

Charging Test

As a real-world demonstration of the DingoCharge software, I created a test setup that charged a 600mAh/7.4V nominal battery pack (a rechargeable 9V alternative that’s built from disposable vape batteries – stay tuned for that blog post!) at a 1C (600mA) rate at 8.4V (4.2V per cell) until the current tapered off to C/10 (30mA); note that the pack I was charging was built with high-drain cells that can handle higher currents than normal, and most commercial cells are best charged at a C/5 to C/2 rate. I used a Samsung EP-TA800 USB-C adapter, capable of a maximum of 25W at full power (11V at 2.25A).

Demonstration of DingoCharge charging a 9V Li-ion replacement, using a Samsung 25W USB-C PD adapter.

Demonstration of DingoCharge charging a 9V Li-ion replacement, using a Samsung 25W USB-C PD adapter. (click here for full-size image)

Block diagram describing the DingoCharge hardware setup.

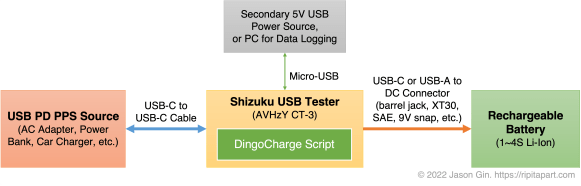
Block diagram describing the DingoCharge hardware setup. All power conversion (and associated power conversion losses) occur only in the power source, with the tester simply issuing commands to control the power going into the battery. (click here for full-size image)

Voltage/current plot of DingoCharge charging a battery at 600mA and 8.4 volts, using a Samsung EP-TA800 USB-C PD adapter.

Voltage/current plot of DingoCharge charging a battery at 600mA and 8.4 volts, using a Samsung EP-TA800 USB-C PD adapter. (click here for full-size image)

The classic CC-CV charge profile is visible when the charging current and voltage is graphed over time. The stepped nature of the current is a consequence of the PPS voltage being limited to 20mV granularity, causing jumps in current draw as each step occurs. The voltage is increased or decreased when the current or voltage being sent to the battery falls out of a certain range (in this case, 600mA and a +/-25mA deadband during constant-current charging, and 8.4V +/- 10mV during constant-voltage charging).

One contribution to the relative flatness of the constant-voltage phase is that the charging algorithm is essentially performing four-wire (also known as Kelvin) sensing from the adapter to the tester, inherently compensating for voltage drop across the USB-C cable. This is also why the current flutters a bit as it tapers off, as the voltage at the battery begins to rise above the deadband, resulting in a small amount of oscillation as the algorithm tries to maintain 4.2 +/- 0.01 volts.

Limitations

Nothing in this world is perfect, and neither is my charger implementation. In fact, trying to shoehorn a battery charger into what’s effectively a multimeter and a “wall wart” required a lot of compromises to be made.

No Power Switching

Charge termination is a bit tricky, as most implementations will just electrically disconnect the battery. However, with the tester, there is no power switching available that can be controlled through software. This is mitigated by setting the constant-current algorithm to 0 amps +/- 10 milliamps, resulting in minimal charge/discharge current as the battery voltage drops while it relaxes from a fully-charged state.

One Name, Many Variations

Another limitation is that the PPS protocol allows adapters to not necessarily support the full voltage range of 3.3 to 21 volts. Instead, there are options to support up to 5.9, 11, 16, and/or 21 volts, and at current level up to 5 amps. The large disparity of supported voltages and currents means that the DingoCharge script needs to check the programmed charge parameters against what the adapter supports; many PPS adapters only support up to 11 volts, so 3S (3 cells in series) and higher cell configurations will not work (and an error message will be displayed if that is the case).

My (Electro)chemical Romance Recharge

I designed DingoCharge only for use with lithium-ion type battery chemistries, but have been experimenting with charging other rechargeable batteries, such as lead-acid and nickel-metal hydride/Ni-MH. There has been promising results with both chemistries, but each one is not fully supported as I have not implemented proper 3-stage charging for lead-acid batteries; Ni-MH charging only works by using a low current (C/10 typical) for a fixed period of time via DingoCharge’s time limit feature, or an external temperature sensor alongside the overtemperature protection feature to stop the charge process (a very crude delta-T/change-in-temperature algorithm). Thankfully, the software-based approach of DingoCharge means I can add this functionality in an official capacity with further research and development work… as long as I get around to it 😛 .

Lua Lunacy?

Additionally, this was my first real foray into Lua programming, so I’m pretty certain I’ve made some poor stylistic and other programming choices along the way. For all I know, it could have inherited some significant syntactic defects from my other programming (language) attempts that make it an “awful” program – but hey, it’s an open-source project so if you have some pointers, feel free to help contribute on GitHub (link is in the Downloads section below)!

Conclusion

The USB PD protocol, and its adjustable PPS functionality that was introduced in the PD 3.0 specification, provides a lot of potential use for directly charging batteries since it skips the usual conversion step in a device. However, this type of charging technology was largely untapped by many devices, with only a few smartphones (as of the time of writing) supporting it.

The scriptability of some USB-C testers like the AVHzY CT-3 or Power-Z KT002 allows for a script to handle all of the intricacies of battery charging, while providing an easy-to-use yet highly flexible interface. Thanks to the DingoCharge script, any USB PD PPS adapter and supported USB tester can be used as a universal battery charger.

Downloads

The DingoCharge script can be found on my GitHub profile (https://github.com/ginbot86/DingoCharge-Shizuku), and is open-source under the MIT License. If you have a suitable USB PD PPS adapter and USB-C tester, I’d love to hear if/how well DingoCharge works for your batteries!

Reverse-engineering and analysis of SanDisk High Endurance microSDXC card

As seen on Hackaday!

TL;DR – The SanDisk High Endurance cards use SanDisk/Toshiba 3D TLC Flash. It took way, way more work than it should have to figure this out (thanks for nothing, SanDisk!).
In contrast, the SanDisk MAX Endurance uses the same 3D TLC in pMLC (pseudo-multi-level cell) mode.

In a previous blog post, I took a look at SanDisk’s microSD cards that were aimed for use in write-intensive applications like dash cameras. In that post I took a look at its performance metrics, and speculated about what sort of NAND Flash memory is used inside. SanDisk doesn’t publish any detailed specifications about the cards’ internal workings, so that means I have no choice but to reverse-engineer the can of worms card myself.

The Help Desk That Couldn’t

In the hopes of uncovering more information, I sent an email to SanDisk’s support team asking about what type of NAND Flash they are using in their High Endurance lineup of cards, alongside endurance metrics like P/E (Program/Erase) cycle counts and total terabytes written (TBW). Unfortunately, the SanDisk support rep couldn’t provide a satisfactory answer to my questions, as they’re not able to provide any information that’s not listed in their public spec sheets. They said that all of their cards use MLC Flash, which I guess is correct if you call TLC Flash 3-bit MLC (which Samsung does).

Dear Jason,

Thank you for contacting SanDisk® Global customer care. We really appreciate you being a part of our SanDisk® family.

I understand that you wish to know more about the SanDisk® High Endurance video monitoring card, as such please allow me to inform you that all our SanDisk® memory cards uses Multi level cell technology (MLC) flash. However, the read/write cycles for the flash memory is not published nor documented only the read and write speed in published as such they are 100 MB/S & 40 MB/s. The 64 GB card can record Full HD video up to 10,000 hours. To know more about the card you may refer to the link below:

SANDISK HIGH ENDURANCE VIDEO MONITORING microSD CARD

Best regards,
Allan B.
SanDisk® Global Customer Care

I’ll give them a silver star that says “You Tried” at least.

Anatomy of an SD Card

While (micro)SD cards feel like a solid monolithic piece of technology, they’re made up of multiple different chips, each performing a different role. A basic SD card will have a controller that manages the NAND Flash chips and communicates with the host (PC, camera, etc.), and the NAND Flash itself (made up of 1 or more Flash dies). Bunnie Huang’s blog, Bunnie Studios, has an excellent article on the internals of SD cards, including counterfeits and how they’re made – check it out here.

SD Card Anatomy

Block diagram of a typical SD card.

MicroSD cards often (but not always!) include test pads, used to program/test the NAND Flash during manufacture. These can be exploited in the case of data recovery, or to reuse microSD cards that have a defective controller or firmware by turning the card into a piece of raw NAND Flash – check out Gough Lui’s adventures here. Note that there is no set standard for these test pads (even for the same manufacturer!), but there are common patterns for some manufacturers like SanDisk that make reverse-engineering easier.

Crouching Controller, Hidden Test Pads

microSD cards fall into a category of “monolithic” Flash devices, as they combine a controller and raw NAND Flash memory into a single, inseparable package. Many manufacturers break out the Flash’s data bus onto hidden (and nearly completely undocumented) test pads, which some other memory card and USB drive manufacturers take advantage of to make cheap storage products using failed parts; the controller can simply be electrically disabled and the Flash is then used as if it were a regular chip.

In the case of SanDisk cards, there is very limited information on their cards’ test pad pinouts. Each generation has slight differences, but the layout is mostly the same. These differences can be fatal, as the power and ground connections are sometimes reversed (this spells instant death for a chip if its power polarity is mixed up!).

CORRECTION (July 22, 2020): Upon further review, I might have accidentally created a discrepancy between the leaked pinouts online, versus my own documentation in terms of power polarity; see the “Test Pad Pinout” section.

My card (and many of their higher-end cards – that is, not their Ultra lineup) features test pads that aren’t covered by solder mask, but are instead covered by some sort of screen-printed epoxy with a laser-etched serial number on top. With a bit of heat and some scraping, I was able to remove the (very brittle) coating on top of the test pads; this also removed the serial number which I believe is an anti-tamper measure by SanDisk.

After cleaning off any last traces of the epoxy coating, I was greeted with the familiar SanDisk test pad layout, plus a few extra on the bottom.

Building the Breakout Board

The breakout board is relatively simple in concept: for each test pad, bring out a wire that goes to a bigger test point for easier access, and wire up the normal SD bus to an SD connector to let the controller do its work with twiddling the NAND Flash bus. Given how small each test pad is (and how many), things get a bit… messy.

I started by using double-side foam adhesive tape to secure the SD card to a piece of perfboard. I then tinned all of the pads and soldered a small 1uF ceramic capacitor across the card’s power (Vcc) and ground (GND) test pads. Using 40-gauge (0.1 mm, or 4-thousandths of an inch!) magnet wire, I mapped each test pad to its corresponding machine-pin socket on the perfboard. Including the extra test pads, that’s a total of 28 tiny wires!

For the SD connector side of things, I used a flex cable for the XTC 2 Clip (a tool used to service HTC Android devices), as it acted as a flexible “remote SD card” and broke out the signals to a small ribbon cable. I encased the flex cable with copper tape to act as a shield against electrical noise and to provide physical reinforcement, and soldered the tape to the outer pads on the perfboard for reinforcement. The ribbon cable end was then tinned and each SD card’s pin was wired up with magnet wire. The power lines were then broken out to an LED and resistor to indicate when the card was receiving power.

Bus Analysis

With all of the test pads broken out to an array of test pins, it was time to make sense of what pins are responsible for accessing the NAND Flash inside the card.

Test Pad Pinout

Diagram of the test pads on SanDisk's High Endurance microSD card.

Diagram of the test pads on SanDisk’s High Endurance microSD card. (click to enlarge)

The overall test pad pinout was the same for other microSD cards from SanDisk, but there were some differences, primarily regarding the layout of the power pads; notably, the main power pins are backwards! This can destroy the card if you’re not careful when applying power.

CORRECTION (July 22, 2020): I might actually have just gotten my own documentation mixed up in terms of the power and ground test pads. Regardless, one should always be careful to ensure the correct power polarity is sent to a device.

I used my DSLogic Plus logic analyzer to analyze the signals on all of the pins. Since the data pinout was previously discovered, the hard part of figuring out what each line represented (data bus, control, address, command, write-protect, ready/busy status) was already done for me. However, not all of the lines were immediately evident as the pinouts I found online only included the bare minimum of lines to make the NAND Flash accessible, with one exception being a control line that places the controller into a reset state and releases its control of the data lines (this will be important later on).

By sniffing the data bus at the DSLogic’s maximum speed (and using its 32 MB onboard buffer RAM), I was able to get a clear snapshot of the commands being sent to the NAND Flash from the controller during initialization.

Bus Sniffing & NAND I/O 101 (writing commands, address, reading data)

In particular, I was looking for two commands: RESET (0xFF), and READ ID (0x90). When looking for a command sequence, it’s important to know how and when the data and control lines change. I will try to explain it step-by-step, but if you’re interested there is an introductory white paper by Micron that explains all of the fundamentals of NAND Flash with much more information about how NAND Flash works.

When a RESET command is sent to the NAND Flash, first the /CE (Chip Select, Active Low) line is pulled low. Then the CLE (Command Latch Enable) line is pulled high; the data bus is set to its intended value of 0xFF (all binary ones); then the /WE (Write Enable, Active Low) line is pulsed from high to low, then back to high again (the data bus’ contents are committed to the chip when the /WE line goes from low to high, known as a “rising edge”); the CLE line is pulled back low to return to its normal state. The Flash chip will then pull its R/B (Ready/Busy Status) line low to indicate it is busy resetting itself, then releases the line back to its high state when it’s finished.

The READ ID command works similarly, except after writing the command with 0x90 (binary 1001 0000) on the data bus, it then pulls the ALE (Address Latch Enable) line high instead of CLE, and writes 0x00 (all binary zeroes) by pulsing the /WE line low. The chip transfers its internally programmed NAND Flash ID into its internal read register, and the data is read out from the device on each rising edge of the /RE (Read Enable, Active Low) line; for most devices this is 4 to 8 bytes of data.

NAND Flash ID

For each NAND Flash device, it has a (mostly) unique ID that identifies the manufacturer, and other functional data that is defined by that manufacturer; in other words, only the manufacturer ID, assigned by the JEDEC Technology Association, is well-defined.

The first byte represents the Flash manufacturer, and the rest (2 to 6 bytes) define the device’s characteristics, as set out by the manufacturer themselves. Most NAND vendors are very tight-lipped when it comes to datasheets, and SanDisk (and by extension, Toshiba/Kioxia) maintain very strict control, save for some slightly outdated leaked Toshiba datasheets. Because the two aforementioned companies share their NAND fabrication facilities, we can reasonably presume the data structures in the vendor-defined bytes can be referenced against each other.

In the case of the SanDisk High Endurance 128GB card, it has a NAND Flash ID of 0x45 48 9A B3 7E 72 0D 0E. Some of these values can be compared against a Toshiba datasheet:

Byte Value (Hex) Description/Interpretation
45
  • Manufacturer: SanDisk
48
  • I/O voltage: Presumed 1.8 volts (measured with multimeter)
  • Device capacity: Presumed 128 GB (unable to confirm against datasheet)
9A
  • NAND type: TLC (Triple-Level Cell / 3 bits per cell)
  • Flash dies per /CE: 4 (card uses four 32GB Flash chips internally)
B3
  • Block size: 12 MiB (768 pages per block) excluding spare area (determined outside datasheet)
  • Page size: 16,384 bytes / 16 kiB excluding spare area
7E
  • Planes per /CE: 8 (2 planes per die)
72
  • Interface type: Asynchronous
  • Process geometry: BiCS3 3D NAND (determined outside datasheet)
0D
  • Unknown (no information listed in datasheet)
0E
  • Unknown (no information listed in datasheet)

Although not all byte values could be conclusively determined, I was able to determine that the SanDisk High Endurance cards use BiCS3 3D TLC NAND Flash, but at least it is 3D NAND which improves endurance dramatically compared to traditional/planar NAND. Unfortunately, from this information alone, I cannot determine whether the card’s controller takes advantage of any SLC caching mechanisms for write operations.

The chip’s process geometry was determined by looking up the first four bytes of the Flash ID, and cross-referencing it to a line from a configuration file in Silicon Motion’s mass production tools for their SM3271 USB Flash drive controller, and their SM2258XT DRAM-less SSD controller. These tools revealed supposed part numbers of SDTNAIAMA-256G and SDUNBIEMM-32G respectively, but I don’t think this is accurate for the specific Flash configuration in this card.

External Control

I wanted to make sure that I was getting the correct ID from the NAND Flash, so I rigged up a Texas Instruments MSP430FR2433 development board and wrote some (very) rudimentary code to send the required RESET and READ ID commands, and attempt to extract any extra data from the chip’s hidden JEDEC Parameter Page along the way.

My first roadblock was that the MSP430 would reset every time it attempted to send the RESET command, suggesting that too much current was being drawn from the MSP430 board’s limited power supply. This can occur during bus contention, where two devices “fight” each other when trying to set a certain digital line both high and low at the same time. I was unsure what was going on, since publicly-available information didn’t mention how to disable the card’s built-in controller (doing so would cause it to tri-state the lines, effectively “letting go” of the NAND bus and allowing another device to take control).

I figured out that the A1 test pad (see diagram) was the controller’s reset line (pulsing this line low while the card was running forced my card reader to power-cycle it), and by holding the line low, the controller would release its control of the NAND Flash bus entirely. After this, my microcontroller code was able to read the Flash ID correctly and consistently.

Reading out the card's Flash ID with my own microcontroller code.

Reading out the card’s Flash ID with my own microcontroller code.

JEDEC Parameter Page… or at least what SanDisk made of it!

The JEDEC Parameter Page, if present, contains detailed information on a Flash chip’s characteristics with far greater detail than the NAND Flash ID – and it’s well-standardized so parsing it would be far easier. However, it turns out that SanDisk decided to ignore the standard format, and decided to use their own proprietary Parameter Page format! Normally the page starts with the ASCII string “JEDEC”, but I got a repeating string of “SNDK” (corresponding with their stock symbol) with other data that didn’t correspond to anything like the JEDEC specification! Oh well, it was worth a try.

I collected the data with the same Arduino sketch as shown above, and pulled 1,536 bytes’ worth of data; I wrote a quick program on Ideone to provide a nicely-formatted hex dump of the first 512 bytes of the Parameter Page data:

Offset 00:01:02:03:04:05:06:07:08:09:0A:0B:0C:0D:0E:0F 0123456789ABCDEF
------ --+--+--+--+--+--+--+--+--+--+--+--+--+--+--+-- ----------------
0x0000 53 4E 44 4B 53 4E 44 4B 53 4E 44 4B 53 4E 44 4B SNDKSNDKSNDKSNDK
0x0010 53 4E 44 4B 53 4E 44 4B 53 4E 44 4B 53 4E 44 4B SNDKSNDKSNDKSNDK
0x0020 08 08 00 08 06 20 00 02 01 48 9A B3 00 05 08 41 ..... ...H.....A
0x0030 48 63 6A 08 08 00 08 06 20 00 02 01 48 9A B3 00 Hcj..... ...H...
0x0040 05 08 41 48 63 6A 08 08 00 08 06 20 00 02 01 48 ..AHcj..... ...H
0x0050 9A B3 00 05 08 41 48 63 6A 08 08 00 08 06 20 00 .....AHcj..... .
0x0060 02 01 48 9A B3 00 05 08 41 48 63 6A 08 08 00 08 ..H.....AHcj....
0x0070 06 20 00 02 01 48 9A B3 00 05 08 41 48 63 6A 08 . ...H.....AHcj.
0x0080 08 00 08 06 20 00 02 01 48 9A B3 00 05 08 41 48 .... ...H.....AH
0x0090 63 6A 08 08 00 08 06 20 00 02 01 48 9A B3 00 05 cj..... ...H....
0x00A0 08 41 48 63 6A 08 08 00 08 06 20 00 02 01 48 9A .AHcj..... ...H.
0x00B0 B3 00 05 08 41 48 63 6A 08 08 00 08 06 20 00 02 ....AHcj..... ..
0x00C0 01 48 9A B3 00 05 08 41 48 63 6A 08 08 00 08 06 .H.....AHcj.....
0x00D0 20 00 02 01 48 9A B3 00 05 08 41 48 63 6A 08 08  ...H.....AHcj..
0x00E0 00 08 06 20 00 02 01 48 9A B3 00 05 08 41 48 63 ... ...H.....AHc
0x00F0 6A 08 08 00 08 06 20 00 02 01 48 9A B3 00 05 08 j..... ...H.....
0x0100 41 48 63 6A 08 08 00 08 06 20 00 02 01 48 9A B3 AHcj..... ...H..
0x0110 00 05 08 41 48 63 6A 08 08 00 08 06 20 00 02 01 ...AHcj..... ...
0x0120 48 9A B3 00 05 08 41 48 63 6A 08 08 00 08 06 20 H.....AHcj..... 
0x0130 00 02 01 48 9A B3 00 05 08 41 48 63 6A 08 08 00 ...H.....AHcj...
0x0140 08 06 20 00 02 01 48 9A B3 00 05 08 41 48 63 6A .. ...H.....AHcj
0x0150 08 08 00 08 06 20 00 02 01 48 9A B3 00 05 08 41 ..... ...H.....A
0x0160 48 63 6A 08 08 00 08 06 20 00 02 01 48 9A B3 00 Hcj..... ...H...
0x0170 05 08 41 48 63 6A 08 08 00 08 06 20 00 02 01 48 ..AHcj..... ...H
0x0180 9A B3 00 05 08 41 48 63 6A 08 08 00 08 06 20 00 .....AHcj..... .
0x0190 02 01 48 9A B3 00 05 08 41 48 63 6A 08 08 00 08 ..H.....AHcj....
0x01A0 06 20 00 02 01 48 9A B3 00 05 08 41 48 63 6A 08 . ...H.....AHcj.
0x01B0 08 00 08 06 20 00 02 01 48 9A B3 00 05 08 41 48 .... ...H.....AH
0x01C0 63 6A 08 08 00 08 06 20 00 02 01 48 9A B3 00 05 cj..... ...H....
0x01D0 08 41 48 63 6A 08 08 00 08 06 20 00 02 01 48 9A .AHcj..... ...H.
0x01E0 B3 00 05 08 41 48 63 6A 08 08 00 08 06 20 00 02 ....AHcj..... ..
0x01F0 01 48 9A B3 00 05 08 41 48 63 6A 08 08 00 08 06 .H.....AHcj.....

Further analysis with my DSLogic showed that the controller itself requests a total of 4,128 bytes (4 kiB + 32 bytes) of Parameter Page data, which is filled with the same repeating data as shown above.

Reset Quirks

When looking at the logic analyzer data, I noticed that the controller sends the READ ID command twice, but the first time it does so without resetting the Flash (which should normally be done as soon as the chip is powered up!). The data that the Flash returned was… strange to say the least.

Byte Value (Hex) Interpreted Value
98
  • Manufacturer: Toshiba
00
  • I/O voltage: Unknown (no data)
  • Device capacity: Unknown (no data)
90
  • NAND type: SLC (Single-Level Cell / 1 bit per cell)
  • Flash dies per /CE: 1
93
  • Block size: 4 MB excluding spare area
  • Page size: 16,384 bytes / 16 kiB excluding spare area
76
  • Planes per /CE: 2
72
  • Interface type: Asynchronous
  • Process geometry: 70 nm planar

This confused me initially when I was trying to find the ID from the logic capture alone; after talking to a contact who has experience in NAND Flash data recovery, they said this is expected for SanDisk devices, which make liberal use of vendor-proprietary commands and data structures. If the fourth byte is to be believed, it says the block size is 4 megabytes, which I think is plausible for a modern Flash device. The rest of the information doesn’t really make any sense to me apart from the first byte indicating the chip is made by Toshiba.

Conclusion

I shouldn’t have to go this far in hardware reverse-engineering to just ask a simple question of what Flash SanDisk used in their high-endurance card. You’d think they would be proud to say they use 3D NAND for higher endurance and reliability, but I guess not!

Downloads

For those that are interested, I’ve included the logic captures of the card’s activity shortly after power-up. I’ve also included the (very crude) Arduino sketch that I used to read the NAND ID and Parameter Page data manually:

HDQ Utility version 0.96 now available!

Whew, I’ve been working on this version for quite a while. With the helpful feedback of many people that have tried my software, I’ve made a large number of improvements to the software; of course, there are plenty of features that aren’t implemented yet, but are being worked on.

More information about how this utility works can be found here.

Download HDQ Utility v0.96 here: https://www.dropbox.com/s/pf0vszgfei7s8ly/HDQ%20Utility%200.96.zip?dl=0

Updates

  • (Major improvement!) Improved HDQ logging functionality (logs are now saved to a separate file instead of being overwritten).
    • Example: “HDQ Log (2015-10-26 at 19.02.50) – HDQ Utility v0.96.txt”
  • Improved HDQ communication (HDQ breaks no longer require the serial port to be opened more than once, and HDQ no-response timeouts are decreased from 0.5 to 0.3 seconds.
  • Reworded certain error messages for clarity.
    • Example: “Communication error: Cannot read byte from address 0x02 (No response from device).” 
  • Renamed file ‘config.txt’ to ‘Config – COM Port.txt’ for clarity.
  • Improved state-of-health warnings by making them non-modal (they do not require the user to dismiss the message).
  • Added more notifications for unidentified and uninitialized batteries. (Uninitialized batteries are determined by a FULL ACCESS security state, with Impedance Track disabled.)
  • Fixed invalid device name and maximum load current readings for v5.02/sn27545-A4 based batteries (e.g. iPhone 6, 6+…).
  • Added time-to-full readings (for firmware older than v2.24).
  • Improved error-checking for device identification (it will display a notice that the tool may need to be restarted).
  • Updated DingoLib UI library to auto-resize window to 0.9x display resolution for improved readability on larger monitors.

To-Do

  • Create a dedicated section on my blog for the HDQ Utility.
  • Create a user’s manual describing the parameters displayed by the program (in particular, the Advanced Battery Information section).
  • Improve data logging functionality by saving logs to a subdirectory instead of the program’s root to decrease file clutter.
  • Improve error-checking for commands (retry reads if one or more bytes are not received from the device).
  • Add error statistics indicating how many communication errors occurred during data collection.
  • Improve support for older (older than v1.25) firmware.
  • Improve support for v5.02/sn27545-A4 devices (make use of advanced commands available in this firmware version).
  • Add support for restarting of data collection without having to re-execute the program.
  • Add Data Flash memory functions to allow for readout of advanced configuration, serial number, lifetime/black-box data, etc.
  • Rewrite this program in something that’s not LabWindows/CVI… also, use of a GUI rather than a non-console text UI.

Reading out HDQ-equipped battery fuel gauges with a serial port

Battery fuel gauges are the unsung hero of the battery world. There’s more to it than just measuring the voltage on the battery terminals,. These little chips are microcontrollers (tiny computers, essentially) that sit inside the battery pack and keep tabs on the battery’s performance for the life of that battery pack.

Texas Instruments makes battery fuel gauges that are small enough to fit in the circuitry of a cell phone, and one of the most common ones that uses this technology are iPhone batteries. These batteries use a single-wire interface called HDQ (which stands for High-Speed Data Queue). It may sound similar to Dallas Semiconductors’ 1-Wire protocol, but the two are completely different and incompatible with each other.

Protocol details

The HDQ protocol can be emulated with a serial port and a little bit of external circuitry. The protocol can be emulated with a serial port at 57600 baud with 8 data bits, no parity bit and 2 stop bits. Because this is a bi-directional bus, an open-drain configuration is needed. Most TTL serial ports are not open-drain, so some circuitry is required to do this. TI’s application note suggests using a CMOS inverter and an N-channel MOSFET along with a 1 kOhm pull-up resistor, but this can be cut down with a 74HC07 open-drain buffer and pull-up resistor.

[EDIT: June 13, 2015 – Corrected schematic]

The HDQ protocol uses a short pulse to indicate a logic 1, with a longer pulse to indicate a logic 0. The data is sent LSB (least significant byte) first, with a 7-bit address and an eighth bit to indicate if the operation is a read or write (0 is read, 1 is write). If it is a read operation, the fuel gauge will respond with one byte of data. As you might think, this is a very slow means of communication; the typical bus speed is 5-7 kilobits per second, but the actual usable throughput will be less than this.

The hack in this is that the bit timing can be made by sending a specially crafted UART byte that meets the timing specifications. Each bit takes up one byte of UART buffer memory, with 24 bytes being enough to perform an HDQ read (the first 8 bytes are echoed back to the PC and need to be ignored by the software). TI’s application note goes into this with a bit more detail.

Windows HDQ utility

HDQ utility icon, in all its pixelated glory.

HDQ utility icon, in all its pixelated glory.

I have written a small Windows program that will read out the battery’s main data, identify as a certain iPhone battery model (most iPhone batteries are supported), and save a copy of this data to a text file for safekeeping. This program requires the National Instruments LabWindows/CVI Runtime library to run, since I whipped this program up with the first available IDE on my college PC.

fdd82eef8d

Screenshot of HDQ Utility version 0.96

The source code is not yet available (translation: I’m too ashamed of my programming skills to share it with others); however, a Windows executable is available for download below.

You will need to download the National Instruments LabWindows/CVI Runtime to run this program.

Current version (0.96): https://www.dropbox.com/s/pf0vszgfei7s8ly/HDQ%20Utility%200.96.zip?dl=0

Version 0.95: https://www.dropbox.com/s/7xdurbh9qibdftl/HDQ%20Utility%200.95.zip?dl=0
Version 0.9: https://www.dropbox.com/s/cd3esa5us6elfgr/HDQ%20Utility.zip?dl=0

Contributions are always accepted! Email me if you would like to send in a battery for me to analyze, or you can buy me a coffee through PayPal:


[EDIT – July 28, 2016] Welp, looks like the PayPal button’s broken (or was it never working to begin with…?). If you’d like to send anything to me, just give me a shout at ginbot86@gmail.com!

[EDIT – August 2, 2016] Whoops, looks like I never had the button working in the first place. Hopefully it works this time.