Review and analysis of XTAR 3600 mAh 18650 Li-Ion protected battery

TL;DR – Yes, the XTAR 3600 mAh protected 18650 battery meets its rated capacity! Just make sure your device can drain down to 2.5 volts.

The 18650 lithium-ion battery, named after its size (1.8 cm diameter and 6.50 cm length), has seen continuous improvements in capacity over the years. Nowadays it’s easy to get capacities in excess of 3000 mAh, with the highest capacity cells reaching and even exceeding 3500 mAh.

The XTAR 3600mAh protected 18650 lithium-ion battery, pictured with its original box.

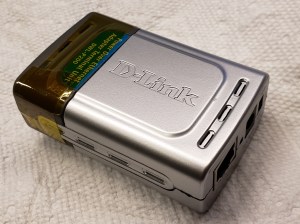
The XTAR 3600 mAh protected 18650 lithium-ion battery, pictured with its original box.

Earlier this year, XTAR, a Chinese company specializing in batteries and battery accessories, announced the newest and highest-capacity addition to their protected 18650 lineup, boasting an impressive 3600 mAh capacity and aimed towards medium-drain applications like power banks and LED flashlights (sorry vapers, this one’s not for you!). After submitting my name for consideration, I was one of a few people selected to receive some samples for review; considering how much I’ve blogged about lithium-ion batteries on here, it only makes sense to talk even more about them!

FULL DISCLOSURE: XTAR provided these batteries to me at no charge for an independent review. They had no editorial control over this review, I have not been compensated monetarily, and all opinions expressed in this review are my own.

Introduction

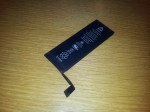
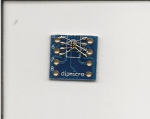
XTAR’s new 3600 mAh protected 18650 comes in a discreet box, holding nothing more than the battery itself. Like all protected 18650s, the protection comes in the form of a small PCB (printed circuit board) that is stacked on the negative end of the bare 18650 cell, with a metal strap running up the cell’s body to the positive terminal, where a small “button top” is attached to improve electrical connectivity for spring-loaded battery holders.

Positive and negative terminals of the XTAR 3600mAh protected 18650 battery.

Positive and negative terminals of the XTAR 3600 mAh protected 18650 battery. Note the added length due to the button top on the left, and the protection circuit and protective plate on the right.

I was able to request an official datasheet for the battery, which I have included at the end of my blog post. My main goal with this review is to test the batteries from an objective perspective, using dedicated test equipment rather than in-application testing in devices like flashlights. If I do decide to perform such tests, I’ll add a second part to my review (stay tuned!).

Datasheet specifications

Parameter Value
Cell manufacturer (Unspecified)
Nominal voltage 3.6 V
Nominal capacity 3600 mAh
Minimum capacity 3500 mAh
Discharge cutoff voltage 2.5 V
Cycle life @ 80% capacity At least 300 times
(0.5C charge to 4.2 V, 0.03C taper; 0.5C discharge to 2.5 V)
Size 18.1~18.7 mm diameter
68.3~69.3 mm length
Weight ≤50 g
Internal AC resistance ≤45 mΩ
Standard charge CC 720 mA
CV 4.2 V
Taper 50 mA
Fast charge CC 2500 mA (0.7C)
CV 4.2 V
Taper 36 mA (0.01C)
Standard charge voltage 4.2 V
Standard discharge 720 mA CC to 2.5 V
Continuous discharge current >8.5 A
Overvoltage protection Trip 4.25~4.35 V
Recover 4.0~4.2 V
Undervoltage protection Trip 2.4~2.5 V
Recover 2.8~3.0 V
Overcurrent protection Trip 11~13 A
Working temperature Charging: 0~45 °C
Discharging -20~60 °C

Test 1: EBL TC-X Pro battery analyzer

Initial testing of the batteries was tested using my EBL TC-X Pro 4-bay battery analyzer. The test procedure for the batteries was performed as follows:

  1. Record out-of-box/initial voltage before charging
  2. Run automatic capacity test with programmed 1500 mA charge current to 4.2 V, and fixed 500 mA discharge to 2.75 V (charge -> discharge -> charge); record discharge capacity and reported internal resistance
  3. Run manual discharge test with fixed 500 mA current to 2.75 V; record discharge capacity and reported internal resistance
  4. Run manual charge with 1500 mA charge current to 3.65V/LiFePO4 mode (moderate voltage is best for long-term storage); record charge capacity
Parameter (charge current = 1.5A) Cell 1 (bay 1) Cell 2 (bay 2)
Initial voltage (V) 3.65 3.55
Capacity run 1 (mAh @ 2.75 V end of discharge) 3349 3369
Capacity run 2 (mAh @ 2.75 V end of discharge) 3334 3386
Internal resistance run 1 (mΩ) 54.9 46.9
Internal resistance run 2 (mΩ) 53.4 45.1
Storage capacity (mAh charged to 3.65 V) 1402 1494

The capacity numbers seemed a bit low to me, even for an incomplete discharge to 2.75 volts instead of 2.5 volts. I decided to continue testing with a more accurate (and calibratable) battery fuel gauge board, revealing the true capacity of this battery… and it’s as good as the manufacturer promised!

Test 2: Texas Instruments bq78z100 fuel gauge

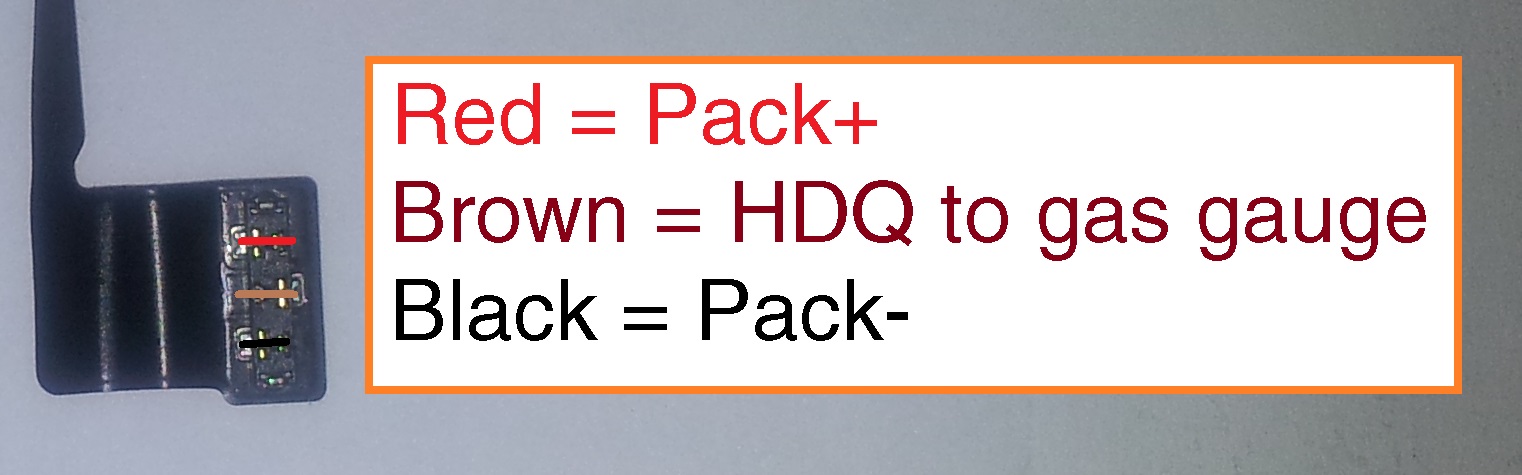
After realizing that my dedicated battery analyzer wasn’t quite as accurate as I wanted, I decided to use a battery fuel gauge board that I had more confidence in. I had previously built a board based on the Texas Instruments bq78z100, a dedicated battery management system (BMS) on a chip, aimed at 1S and 2S battery packs. This allowed me to calibrate the voltage and current measurements against my Agilent/Keysight U1253B multimeter and therefore get the most accurate results, as I can also program the bq78z100’s autonomous protection features to provide precise control over the discharge cutoff voltage during testing.

Example of the bq78z100-based fuel gauge board being connected to the XTAR 3600mAh protected 18650 battery. (note: actual setup is different than as pictured)

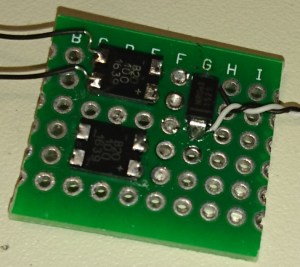
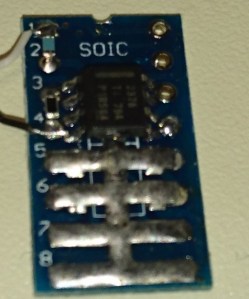
XTAR 3600 mAh protected 18650 battery connected to the bq78z100-based fuel gauge board. (note: actual setup is different than as pictured)

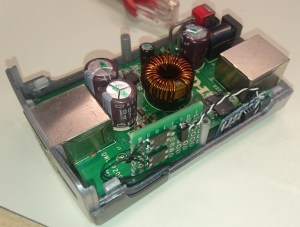
Using this circuit, I was able to get multiple measurements of the battery’s capacity with the help of a Texas Instruments GDK (Gauge Development Kit) as a charger and adjustable load for some of the capacity tests; and an Arachnid Labs re:load 2 adjustable constant-current load, with some additional forced-air cooling for the higher discharge rates.

I suspect that if I had a more, erm, “professional” setup, I could extract even more capacity from the battery, as additional resistance between the battery and the fuel gauge board will cause a voltage drop and subsequent loss in measured capacity.

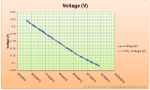
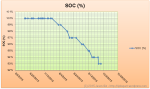
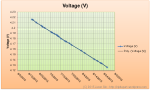
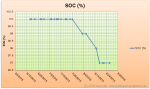
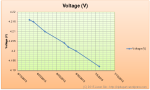
Available capacity vs. end-of-discharge voltage

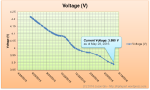
This is one of the most interesting test results, in my opinion. Many 1S/”single-cell” devices can’t take full advantage of modern NMC (nickel-manganese-cobalt) cells whose end-of-discharge voltage is below 3 volts, and the following chart helps quantify how much capacity can be extracted if one stops earlier than that. One advantage of reducing the depth of discharge, however, is that it can extend the battery’s cycle life and reduce the amount of capacity loss it experiences with age. As long as you discharge all the way to 2.5 volts and at a modest rate, the XTAR 3600 mAh battery achieves its rated capacity, and then some!

Chart plotting the XTAR 3600mAh protected 18650's voltage, compared to discharge capacity and discharge rate.

XTAR 3600 mAh protected 18650’s voltage/capacity curves at various discharge rates. (click here for full-size chart)

Discharge Rate Capacity/DoD@ 3.3V
(Rel/Abs)
Capacity/DoD @ 3.0V
(Rel/Abs)
Capacity/DoD @ 2.75V
(Rel/Abs)
Capacity/DoD @ 2.5V
(Rel/Abs)
C/10
(350 mA)
2616 mAh
72.4%/72.4%
3357 mAh
92.9%/92.9%
3539 mAh
97.8%/97.8%
3613 mAh
100%/100%
C/5
(720 mA)
2555 mAh
(N/A)/70.7%
3250 mAh
(N/A)/90.0%
(No Data) (No Data)
C/2
(1800 mA)
2310 mAh
67.2%/64.0%
3076 mAh
89.4%/85.1%
3338 mAh
97.1%/92.3%
3438 mAh
100%/95.2%
1C
(3600 mA)
1995 mAh
57.2%/55.2%
2874 mAh
82.4%/79.5%
3330 mAh
95.5%/92.2%
3486 mAh
100%/96.5%

Note that “relative” and “absolute” percentages correspond to the 2.5 volt discharge values for each row and the C/10 rate, respectively. The curve for the C/5 discharge rate ends early, as that data was collected with my Texas Instruments GDK (Gauge Development Kit), which has a hardcoded discharge cutoff at 2.9 volts. One oddity of the 1C curve is how it actually gets slightly more capacity than the C/2 rate; I suspect this is because the internal resistance of the battery was decreasing due to cell heating, allowing the lithium ions to travel across the cell’s separator more easily. Additionally, the capacity under-reporting issue I was having with the EBL tester is more visible in this chart, since a rough extrapolation would bring the discharge curve at 500 mA around 3550 mAh, which is a fair amount higher than the measured ~3340 mAh. If I have the time to recollect some data, I’ll add it to the chart.

Thermal performance

I don’t have the equipment to test beyond a 1C discharge rate, but even at a C/2 discharge rate I noticed significant heating of the battery; nothing disconcerting but still noteworthy. At 1C, the temperature rose to just over 40 degrees Celsius (104 degrees Fahrenheit) by the end of the discharge cycle – definitely warm to the touch but not burning hot. However, I imagine that a discharge rate at 2C or even higher will result in battery temperatures exceeding 50 degrees Celsius (122 degrees Fahrenheit), hot enough to be uncomfortable to hold. Note that lithium-ion batteries should not be charged if they are warmer than 45 degrees Celsius (113 degrees Fahrenheit).

Chart plotting the XTAR 3600mAh protected 18650's temperature, compared to discharge capacity and discharge rate.

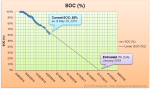
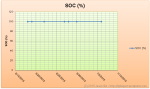
XTAR 3600 mAh protected 18650’s temperature curves at various discharge rates. (click here for full-size chart)

Chemistry analysis

After running the data taken at a C/10 discharge rate through TI’s online tool, GPCCHEM, I was able to get two chemistry IDs that would allow me to get an accurate model of the cells for use in their Impedance Track line of fuel gauges.

Chemistry ID (hex) Chemistry Description Cell match Max DoD error (%) Max Ra deviation ratio
5267 LiMn2O4 (Co,Ni)/carbon, 4.2 V Bak: N18650CP (3350 mAh) 2.3 0.27
5634 LiMn2O4 (Co,Ni)/carbon, 4.2 V NanoGraf: INR-18650-M38A (3800 mAh) 2.72 0.61

Don’t pay too much attention to the details; they are provided for informational purposes only and mainly of use for those that want to use these batteries with TI’s fuel gauge chips. The specific models listed are not a guarantee that these batteries actually are that cell model, but it does confirm that our data is otherwise trustworthy; both listed models are high-capacity cells and use a chemistry system containing nickel, manganese, and cobalt (NMC for short), and such chemistries tend to have a relatively high capacity at the expense of lower terminal voltage (3.6 V nominal, 2.5 V at end of discharge; versus the typical 3.7 V nominal and 3.0 V end of discharge).

Conclusion

After my testing, I can confidently say that XTAR’s 3600 mAh 18650 really does achieve its rated capacity. As long as your target device is capable of discharging to 2.5 volts and at a modest rate, it will be able to get the most out of this battery.

If you want to purchase this battery, you can do so from their online store: https://xtardirect.com/products/18650-3600mah-battery?VariantsId=10393

At the time of writing, XTAR is selling this battery at $11.90 USD for a single battery, or $23.80 USD for a two-pack with carrying case.

Downloads

The datasheet for the battery can be found here: https://www.dropbox.com/s/wibdm2ty6zfa7xo/XTAR%2018650%203600mAh%20Specification.pdf?dl=1

Performing safer AC line voltage measurements using isolated amplifiers

DISCLAIMER: AC line (mains) voltage is not something to be taken lightly! Attempting to safely handle line voltages while minimizing the risk of harmful or fatal electric shock is the main motivator for me to design and build this circuit. However, I am no electronics engineer and I definitely have no formal training on international standards pertaining to high-voltage safety. I accept no responsibility, direct or indirect, for any damages that may occur if you attempt to make this circuit yourself, including personal harm or property damage. Additionally, there is no warranty or guarantee, express or implied, on any content pertaining to this blog post (or any other posts).

UPDATE (November 19, 2018): Added isolation voltage ratings for the amplifier and DC-DC converter.

As seen on Hackaday!

Back in mid-2017 I won a Keysight DSOX1102G digital storage oscilloscope (DSO), a piece of equipment long on my wish list but never acquired until then. One thing I’ve wanted to be able to measure with an oscilloscope for a long time was the waveform of the AC utility (in other words, the wall outlet). However, doing so presents a very real risk of blowing equipment up or shocking yourself (and possibly other people). In order to prevent this, I needed a way to perform measurements on the AC line without being directly connected to it; in other words, I need galvanic isolation.

Isolation Methods

There are many different ways to achieve galvanic isolation. Common methods are the use of transformers and optocouplers, but they each have their own disadvantages.

Optocouplers (aka optoisolators) are a common component used for isolation, but they require a fair bit of external circuitry to work correctly – not to mention its current transfer ratio (CTR) varies with temperature and age, resulting in drifting measurements over time if a feedback circuit isn’t used. They also aren’t very fast; the common Sharp PC123 optocoupler has a cutoff frequency of only 80 kHz and a response time of 3-18 µs (but newer ones can be much faster).

Transformers don’t require active circuitry and would make stepping down voltages simple. However, their inductive nature causes issues when measuring waveforms with low-frequency content and sharp edges (like the output from modified sine wave inverters), resulting in inaccurate measurements due to the ringing and other distortion that the transformer creates. Additionally, common iron-core transformers aren’t very good at capturing frequencies above 20 kHz.

Solution: Isolation Amplifiers!

I settled on using an isolation amplifier to provide the necessary protection from the AC line and the oscilloscope. Several years ago TI provided sample kits for electronic motor drives, with one component being the AMC1200 isolation amplifier; this is the IC that I used in my AC waveform viewer – however, note that there are some limitations that I will address later in this blog post.

The AMC1200 uses TI’s digital capacitive isolator technology, using high-voltage SiO2 (silicon dioxide) dielectric capacitors on the chip itself for high voltage protection. The amplifier’s input is essentially digitized using a sigma-delta modulator, whose output is then sent digitally across the isolation barrier before being demodulated back into an analog output. It is rated for a working isolation voltage of 1200 Vpeak (848 Vrms), and a maximum isolation voltage of 4000 Vpeak (2828 Vrms), well above the typical voltages experienced on a 120V line.

AC Waveform Viewer Construction


As with most of my projects, my AC waveform viewer is built on FR4 fiberglass perfboard. The isolation components used are the AMC1200 isolation amplifier by Texas Instruments, and its corresponding power supply is the NXE1S0505MC isolated DC-DC module by Murata. It is rated for reinforced insulation up to 125 Vrms and basic insulation up to 250 Vrms, with a production-tested Hi-Pot rating of 3 kVDC. It does provide reinforced insulation at the voltages used in North America, but is still the weaker link in terms of maximum isolation voltage.

The AMC1200 features differential inputs and outputs, with a maximum input voltage of +/- 200 mV intended for use with low-resistance current shunt resistors.

One potential problem with perfboard is that the through-holes compromise the high-voltage isolation of the circuit (reducing the creepage and clearance distances), acting as multiple series spark gaps. The solution to this is similar to how isolation slots are used on commercial PCBs; that is, drill out the holes! This greatly increases the distance between each side of the circuit and improves the safety of the circuit.

The AC voltage input is scaled down to a manageable level via a resistive voltage divider. I used four high-precision 300kOhm resistors in series, plus a 1kOhm resistor placed across the AMC1200’s input terminals. Since the input is floating thanks to galvanic isolation, I decided to place the amplifier’s input in the middle of the voltage divider (that is, 600kOhm of resistance is present from the neutral and line terminals) to provide some extra protection from harmful electric shock; 120 Vrms / 600 kOhm = 0.2 mA to ground is the maximum amount of current that could possibly flow if I were to contact this floating node on the amplifier (this calculation assumes that my body has zero resistance, but human skin resistance is generally much higher than this). The voltage divider and the AC input terminals of my waveform viewer are further insulated with a layer of clear epoxy for even more protection.

The power supply terminals are fused with a 500 mA fuse before being protected by an SMAJ5.0A TVS (transient voltage suppression) diode and filtered with a 22 uF tantalum capacitor. The AMC1200’s output terminals are protected with 5.1 V Zener diodes at the terminal blocks for ESD and overvoltage protection.

Due to the floating nature of the waveform viewer, this essentially is a differential probe for my oscilloscope (and most high-voltage differential probes actually aren’t isolated!).

Circuit Limitations

No circuit is perfect, and mine is no exception. Here’s a few issues with my circuit that I’d like to address:

Isolation limitations

The AMC1200 only provides “basic insulation“; that is, it will provide protection from electric shock as long as its insulation barrier is not damaged (in other words, there is no redundancy). Circuits that have terminals that can be directly touched by humans needs “reinforced” or “double” insulation to be compliant with international regulations.

The NXE11S0505MC isolated DC-DC converter has a maximum working voltage of 125 Vrms for reinforced insulation and 250 Vrms for basic insulation, with a Hi-Pot test at 3 kVDC. This is lower than the AMC1200’s maximum voltage of 4000 volts, but these should still have enough headroom to keep me safe in the event of a mild voltage spike. It might prove useful to add some sort of surge suppression with a MOV (metal oxide varistor) or similar device.

The perfboard layout is also sub-optimal for the sake of isolation. Despite drilling out a row of holes to increase the creepage and clearance distances, it isn’t quite enough to meet regulations, as the clearance is only 3 mm and the the creepage isn’t much better, around 4 mm. This is still more than enough to withstand normal AC line voltages, but there is always a chance that higher-voltage transients will make their way onto the line and the isolation barrier needs to take this into account.

Output limitations

The AMC1200 provides a differential output that is centred (common-mode voltage) at 2.5 V, which can be an issue with single-ended inputs like that on an oscilloscope. I’ve worked around this by using a floating power supply, like a USB power bank, and connecting the oscilloscope’s ground terminal to the AMC1200’s Vout- pin. Also, the AMC1200 has a limited bandwidth of 60-100 kHz, but for the purposes of waveform monitoring it is sufficient; however, the amplifier’s noise and offset also negatively impacts performance as the high attenuation ratio essentially amplifies these values to the point where the AC waveform looks like a 2 Vdc offset and the noise level is so high that I need to use the averaging or high-resolution acquisition modes on an oscilloscope to get a clean waveform.

Power supply limitations

The NXE1 isn’t quite suited for such a low-power task as operating a single amplifier input. According to the datasheet, the output voltage can rise to twice the rated voltage if it is loaded with less than 20 mA. To combat this, I placed a 5.1 volt Zener diode across the output to provide regulation, which unnecessarily wastes power. Another regulated module like the NXF1 series would be a better choice, and the unit cost at one-off quantities isn’t a huge deal either.

Room for improvement

With this circuit working properly, I had plenty of ideas to make the second iteration even better:

Simultaneous voltage/current inputs

With the ability to measure current, I can perform measurements on the current draw of a device, allowing me to determine the power factor of a device.

True single-ended outputs

Most ground-referenced devices like oscilloscopes are not meant to handle differential inputs directly. Multimeters, especially battery-powered ones, are an exception.

Reinforced insulation rating on amplifier

The AMC1200 is only rated for basic insulation, so having an amplifier rated for reinforced insulation would provide greater electric shock protection. Alternatives like the Silicon Labs Si8920 could be a viable solution.

Waveform captures


Conclusion

Despite its ubiquity, AC power is a force that must not be taken lightly. Performing measurements on it, especially when viewing its waveform on a non-isolated oscilloscope, requires extreme caution as line voltage (especially in countries where 230 V is common) can easily injure or kill.

Using a voltage divider and isolation amplifier allows for safer measurements of the AC line without introducing distortion, especially compared to transformer-based implementations; this is critical when measuring the waveforms of modified sine wave inverters.

My implementation of an isolated differential probe helps protect me from electric shock when making measurements, while costing much less than a commercial high-voltage differential probe (for example, the CT2593-1, costs almost $330 USD on DigiKey).

But… which one would you trust more?

Upgrading a passive Power over Ethernet splitter with 802.3af compatibility

As seen on Hackaday!

If you haven’t heard of Power over Ethernet, chances are you’ve experienced its usefulness without even knowing about it. Power over Ethernet (PoE for short) does exactly as the name implies: power is sent over the same Ethernet cable normally used for data transfer. This is often used for devices like IP phones and wireless access points (often you see these APs in restaurants and other establishments mounted to the ceiling to provide Wi-Fi access), as it is far easier, cheaper and safer to provide low-voltage power instead of wiring in AC power which requires the help of a licenced electrician.

A (Very Simplified) Background on Power over Ethernet

The actual PoE standards (click here to learn more) IEEE-802.3af (up to 12.95 watts), 802.3at (up to 25.5 watts) and the newest 802.3bt (up to 60-90 watts) standards provide vendor-independent methods for sending and receiving 48-volt DC power over the Ethernet cable without frying the device on the other end if it’s not equipped to receive power. The PSE (power sourcing equipment) manipulates the Ethernet pairs to sense the presence of a PD (powered device), then queries what power level it should provide; after this negotiation phase, the PSE finally sends 48 volts to the PD (usually on pins 1/2 and 3/6, called Alternative or Mode A) and all is merry, thanks to the help of “phantom power“. However, cheaper devices are available which skip this and simply shove DC power over the Ethernet cable with no regard to the safety or well-being of the remote device – this is called “passive PoE”. There are no regulations regarding passive PoE, but they generally send DC power (often 12, 24 or 48 volts) over Ethernet pins 4/5 and 7/8 (called Alternative or Mode B), usually shorting the two pins on each pair for easy power transmission at the expense of being limited to 10/100 Mbps speed.

Many years ago (I’m talking back in high school, over 6 years ago), I bought some cheap PoE equipment – a D-Link DWL-P200 PoE injector and splitter kit – assuming it was compatible with 802.3af due to its use of 48 volts… it wasn’t. Since I bought this on a trip to the US and I live up in (the arguably nicer 🙂 ) Canada, I couldn’t be bothered attempting to return it to the Fry’s that I bought it from; it served some use powering a wireless router for a few years before I ditched it in favour of a ZyXEL GS1920HP-48HP 802.3at-compatible switch and Ubiquiti UAP-AC-PRO access point. It then sat in my junk bin for a while before I took it back out and conjured up a solution to make the splitter compatible with the PoE standard; this way I could tap into my existing 802.3at-compatible infrastructure I wired into my house (or perhaps use it to siphon a couple watts in other places 🙂 ).

Note I am using the word “compatible” and not “compliant” since this definitely does not attempt to comply with all of the electrical specifications contained in the 802.3af/at standards; however, I have tested this on 802.3af and 802.3at Ethernet switches and have had no issues with the upgraded splitter. One significant attribute is that true PoE requires electrical isolation and my splitter certainly does not provide it; for my use this isn’t an issue and even some commercial splitters omit this feature to reduce cost.

Modifying the D-Link DWL-P200 for 802.3at Compatibility

The DWL-P200 is a near-ideal candidate for conversion to 802.3af/at (I’ll call it “active PoE” from now on) since it already uses 48 volts for power – all it really needs is an active PoE-compatible front-end which requires an Ethernet isolation transformer, two diode bridges, a TVS (transient voltage suppression) diode, a 802.3af PD controller chip (and a partridge in a pear tree?). Easy enough, right… right?

Step 1: Prepare the Power Interface

The DWL-P200 splitter does not use a diode bridge on its power input (pins 4/5 are positive and pins 7/8 are negative), but active PoE requires that PDs include diode bridges for polarity-insensitive operation. Additionally, the splitter does not have an isolation transformer normally used for Ethernet; rather it had 10 ohm resistors on pins 1/2 and 3/6 as series coupling between the input and output – these were removed to provide a spot to install the centre-tapped isolation transformer that active PoE requires for Mode A (power on pins 1/2 and 3/6).

After harvesting an Ethernet transformer from a dead MacBook (seriously, dead computers make for great component stores), I scraped away insulation on the differential data pairs and used 40-gauge magnet wire to connect each pair to the transformer, and used 30-gauge Kynar wire for the power lines which are connected to the centre tap of each pair. To affix it, I used a blob of hot glue (which turned out to be pretty useless since this board runs HOT!), and ran the wires off to one of the diode bridges in the front-end I built.

The data output pins (1, 2, 3 and 6) are terminated to an AC-coupled ground using 75 ohm resistors, often referred to as “Bob Smith termination” to help reduce noise.

Step 2: Build the PoE PD Front-End

The actual front-end was built as two separate boards: the first was the power input board; the second was the 802.3af active PoE PD controller, which had its own construction considerations that I’ll address in a bit.

The power input board is pretty simple and was comprised of two Bourns CD-HD201 60-volt Schottky diode bridges and a SMAJ58A 58-volt TVS surge suppression diode to help overcome voltage spikes that can occur when a cable is unplugged due to the inductance in the cable itself. The inputs of the diode bridges were then connected to the centre taps of the Ethernet transformers and the original pins 4/5 and 7/8 on the power/data input of the splitter.

The second board is the PoE PD controller, which is responsible for negotiating with the 802.3af/at PSE controller at the other end of the cable. I used the Texas Instruments TPS2378 PoE PD controller, which was meant for 802.3at Class 4 (25.5 watts maximum) but I’m only using it for 802.3af Class 0 (up to 12.95 watts). The TPS2378 has a heat-sinking “PowerPAD” on the bottom which must be connected to Vss (ground); I used solar cell tabbing wire underneath and created a sort of fin-like arrangement on the unused area of the DipMicro SOIC/TSSOP-to-DIP adapter board (they don’t sponsor me – I just really like their adapter boards!). The external PoE detection and power class signal resistors were soldered to the DIP pads on the adapter to save space.

Step 3: Put it Back Together Again

Once the two boards were assembled and connected to the original FP5001 DC-DC converter‘s input, the boards were nestled inside the original case and some Kapton tape was wrapped around the case since I damaged some of the plastic clips that held it together during disassembly.

Conclusion

With the active PoE upgrades installed, the splitter now works with 802.3af, 802.3at and passive 48 volt PoE power sources. However, the internal construction of the splitter means it only supports 10/100 Mbps Ethernet. Additionally, I find that the board gets very hot under full load (I’ve measured internal temperatures well above 100 degrees C when the case is closed) which negatively impacts its efficiency, but I consider it a fair trade-off considering this was never meant to work on active PoE in the first place.

Completed: Self-discharge test of Kentli PH5 1.5V Li-ion AA (Part 6)

Looking for the teardown or how well the Kentli PH5 battery performs under load? Click the links to learn more.

It’s finally happened – the self-discharge test of the Kentli PH5 Li-ion AA battery has finally come to an end… and it only took almost 3 years!


april 29 2018 stats

Kentli PH5 self-discharge test statistics

Self-Discharge Rate

I never anticipated this test would run for so long; although the PH5 did not have a manufacturer-specified self-discharge rate, marketing materials suggested that the batteries had a storage life that was “3-5 times longer than Ni-MH batteries”. Wikipedia states that after one year, normal Ni-MH batteries lose about 50% of their capacity, and low-self-discharge (LSD) Ni-MH batteries lose 15-30%.

Correlating this with the data collected from the Texas Instruments bq27621-G1 fuel gauge, the battery lost 40% of its charge within one year, placing it in between the standard and LSD Ni-MH chemistries. Using Excel’s SLOPE() function, the self-discharge rate was calculated to be 0.10108%/day.

Experimental Improvements

There is some error in State of Charge measurement when using the bq27621 fuel gauge. As it uses the Impedance Track algorithm, open-circuit voltage is used to determine a battery’s state of charge upon gauge initialization. This OCV curve is chemistry-specific, with slightly different formulations requiring different chemistry ID codes. The bq27621 has a fixed Chemistry ID of 0x1202 (LiCoO2/LCO cathode, carbon anode), but experimental data revealed a better-matched Chemistry ID of 0x3107, 0x1224 or 0x0380; the first two chemistries pointed towards a LiMnO4/LMO cathode chemistry which I was somewhat skeptical of, but did not test further.

Using another gauge with a different, programmable Chemistry ID could have led to a straighter SoC curve. This wouldn’t be too difficult to reproduce, as the battery voltage can be fed to the gauge in order to recompute the state of charge. Additionally, the bq27621 has a Terminate Voltage of 3.2 volts (the gauge considers this voltage to be the point in which it reads 0% SoC), which is higher than the battery’s protection voltage of 2.4 volts (granted, there is very little charge difference in this area of the discharge curve).

My test setup was not temperature-controlled; I live in a house without air conditioning and room temperatures can vary from 15 to 35 degrees C (59 to 95 degrees F), depending on the season. However, I doubt that this would have had too much impact on discharge rate, and this would better represent real-life scenarios where a constant temperature may not necessarily be guaranteed.

Finally, this test was performed on a new, uncycled battery. I suspect the discharge rate would be significantly higher on an aged battery that was subject to a lot of charge cycles and day-to-day wear.

Conclusion

This was the longest-running experiment I’ve ever conducted on this blog. The Kentli PH5’s self-discharge rate lasts longer than a standard Ni-MH battery, but a LSD (low-self-discharge) Ni-MH battery would still last longer, albeit with a lower terminal voltage. The battery, when new, should be expected to last almost 3 years without a charge (although there won’t be any charge left by then); it will hold about 60% of its capacity after 1 year of storage.

To download a copy of the self-discharge test data, click here.

Self-discharge test of Kentli PH5 1.5V Li-ion AA (Part 5)

It’s amazing – 894 days (and counting) have elapsed since the start of my long-term experiment, documenting the real-world self-discharge behavior of the Kentli 1.5V Li-ion AA battery… and it’s still ongoing! How have things fared so far?

Surprisingly, even after spending nearly 30 months on the shelf, there is still 12% capacity left. The voltage has dropped from 4.216 to 3.692 volts according to my bq27621 Li-ion fuel gauge; the State of Charge (SoC) has dropped 50% since my last update.

november 28 2017 stats

The linear end date prediction is holding pretty steady, having changed slightly to an estimated 0% charge date somewhere in February 2018.

On that note, I’m impressed by how much attention this little battery has received, even years after my initial review. Every day I see a handful of views checking out the teardown and performance metrics, and there seems to be hardly any sign that this will change anytime soon. To everyone who stops by to check out my blog posts: thank you! 🙂

Self-discharge test of Kentli PH5 1.5V Li-ion AA (Part 4)

“It’s been a long time… How have you been?”

It’s been almost a year since I started my discharge test of the Kentli PH5 Li-ion AA battery, and the battery has lost almost 40% of its capacity due to self-discharge.

The discharge curve has gotten a lot less… linear since the last time I posted a self-discharge update. The battery is down to 62% state-of-charge, and its voltage has dropped down to 3.89 volts. Still, there’s a lot of time left until this battery reaches empty… but when?

I’m no statistician, but doing a linear extrapolation in Excel gives an approximate end date of January 2018, and the SLOPE() function in Excel gives me an average drop of 0.111%/day. Of course, this can easily change over the course of this test, but only time will tell…

HDQ Utility version 0.96 now available!

Whew, I’ve been working on this version for quite a while. With the helpful feedback of many people that have tried my software, I’ve made a large number of improvements to the software; of course, there are plenty of features that aren’t implemented yet, but are being worked on.

More information about how this utility works can be found here.

Download HDQ Utility v0.96 here: https://www.dropbox.com/s/pf0vszgfei7s8ly/HDQ%20Utility%200.96.zip?dl=0

Updates

  • (Major improvement!) Improved HDQ logging functionality (logs are now saved to a separate file instead of being overwritten).
    • Example: “HDQ Log (2015-10-26 at 19.02.50) – HDQ Utility v0.96.txt”
  • Improved HDQ communication (HDQ breaks no longer require the serial port to be opened more than once, and HDQ no-response timeouts are decreased from 0.5 to 0.3 seconds.
  • Reworded certain error messages for clarity.
    • Example: “Communication error: Cannot read byte from address 0x02 (No response from device).” 
  • Renamed file ‘config.txt’ to ‘Config – COM Port.txt’ for clarity.
  • Improved state-of-health warnings by making them non-modal (they do not require the user to dismiss the message).
  • Added more notifications for unidentified and uninitialized batteries. (Uninitialized batteries are determined by a FULL ACCESS security state, with Impedance Track disabled.)
  • Fixed invalid device name and maximum load current readings for v5.02/sn27545-A4 based batteries (e.g. iPhone 6, 6+…).
  • Added time-to-full readings (for firmware older than v2.24).
  • Improved error-checking for device identification (it will display a notice that the tool may need to be restarted).
  • Updated DingoLib UI library to auto-resize window to 0.9x display resolution for improved readability on larger monitors.

To-Do

  • Create a dedicated section on my blog for the HDQ Utility.
  • Create a user’s manual describing the parameters displayed by the program (in particular, the Advanced Battery Information section).
  • Improve data logging functionality by saving logs to a subdirectory instead of the program’s root to decrease file clutter.
  • Improve error-checking for commands (retry reads if one or more bytes are not received from the device).
  • Add error statistics indicating how many communication errors occurred during data collection.
  • Improve support for older (older than v1.25) firmware.
  • Improve support for v5.02/sn27545-A4 devices (make use of advanced commands available in this firmware version).
  • Add support for restarting of data collection without having to re-execute the program.
  • Add Data Flash memory functions to allow for readout of advanced configuration, serial number, lifetime/black-box data, etc.
  • Rewrite this program in something that’s not LabWindows/CVI… also, use of a GUI rather than a non-console text UI.

Self-discharge test of Kentli PH5 1.5V Li-ion AA (Part 3)

Aw what, it’s October already? So much for having another blog post in September…
But anyway, “more months, more data!™”

The voltage of the PH5 has dropped down to 4.093 volts as of today (October 1st, 2015), and its State of Charge is now 93%. There’s just enough data to guess the discharge rate of the PH5: with the currently logged data, the PH5 self discharges at approximately 0.103%/day. At this rate, the cell should last years before finally reaching zero. Looks like this will be a very, very long term test…

(At least that would give me more time to procrastinate write blog posts.)

Self-discharge test of Kentli PH5 1.5V Li-ion AA (Part 2)

After my first self-discharge analysis of the Kentli PH5 Li-ion AA battery, I have collected another month’s worth of data.

The battery’s voltage drop has been surprisingly linear. Although I didn’t get the exact day when the bq27621-G1’s State of Charge readout dropped to 99%, it is quite clear that the state of charge is dropping with a fairly steep curve now. That said, because the battery’s voltage is still far away from the ‘flat region’ of the discharge curve, it is difficult to determine when the battery will discharge itself completely at this time.

Self-discharge test of Kentli PH5 1.5V Li-ion AA (Part 1)

As an extension to my previous performance analysis of Kentli’s PH5 Li-ion AA battery, I fully charged an unused PH5 and left it on my desk to self-discharge. Every now and then, a Texas Instruments bq27621-G1 fuel gauge is hooked up to the Li-ion battery terminals (in the case of the PH5, the recessed ring around the 1.5V terminal) and the bq27621’s default settings are used to measure the voltage and state of charge.

I started this test on June 18th, 2015 and will keep taking occasional measurements until the protection IC in the PH5 shuts down.

Since the 18th, the voltage dropped from 4.216 volts down to 4.192 volts as of July 6, 2015; the bq27621’s State of Charge reading remains at 100% for the time being. The voltage drop has been fairly linear so far, but I expect it to taper off as the battery discharges to the Li-ion cell’s “flat region”, and only after that do I expect the cell’s voltage to decline more rapidly.

(Day 2 of 4) Mini-Ramble: Dallas! TI! Batteries!

Today was the first day of the actual Texas Instruments Battery Management Systems event. To my surprise, a couple hundred of people showed up from TI employees, a lot of customers (representatives from various companies like Bose, Google, and many others), and me as well. 🙂

The first day was a basic but still detailed introduction to the inner workings of Li-Ion technology as well as its limitations, failure modes (the gas coming from a Li-Po [lithium-ion polymer] cell contains carbon monoxide, hydrogen and a bunch of other gases), with this leading towards battery fuel gauges and why just measuring the voltage is not enough to accurately determine how full a battery is.

The day ended with a lab showcasing TI’s new Gauge Development Kit (GDK), which, in layman’s terms, is a “battery lab on a board”. It includes PC communication hardware, an adjustable charger, adjustable load and an on-board fuel gauge (but it’s set to use an external fuel gauge by default). I even got a chance to talk the TI battery management team, and even had a dinner with a few key TI guys including the one who made THE design for the GDK.

Looking inside a (fake) iPhone 5S battery

Considering how popular the iPhone is, there’s always going to be some counterfeits out there. I’ve been out buying various iPhone batteries to build a database of each generation’s characteristics, but one model has eluded me so far: the iPhone 5S. The iPhone 5C’s battery that I bought appears to be genuine (but with its own issues), but none of the iPhone 5S batteries I’ve bought so far (4 of them at the time of writing this blog post) were genuine. All of these fakes look like a genuine battery at first glance, but all of them share a few common traits.

Battery teardown

The fake battery sports the usual iPhone battery information, complete with some dot-matrix printed data and a data-matrix barcode. It’s labeled with a capacity of 1560 mAh and 3.8 volts nominal voltage.

Comparison between real and fake iPhone 5S battery

Comparison between real and fake iPhone 5S battery

The connector itself has two points for soldering the connector to provide durability. However, with the fake batteries, they are not soldered down. The two spots on the ends of the connectors are dark with a small point visible inside it (that point is the reinforcement pin on the connector). If this connector is installed in an iPhone, it will probably not come out without either damaging the battery’s connector, or worse, leave the plastic connector piece inside the phone, requiring tweezers to remove.

Connector lifted off with a hobby knife

Connector lifted off with a hobby knife

iPhone 5S and 5C battery pinout

iPhone 5S and 5C battery pinout

Removing the black protective tape reveals an iPhone 4 battery fuel gauge board. The connector is soldered to this board, with four solder points visible.

iPhone 4 battery PCB with soldered-on flat flex connector

iPhone 4 battery PCB with soldered-on flat flex connector

Pulling out the PCB  reveals another characteristic of these fake batteries: the positive terminal is cut short, with another metal section being clumsily spot-welded to the stub on the cell.

Note how the battery tab is poorly welded to the PCB.

Note how the battery tab is poorly welded to the PCB.

Battery fuel gauge data

The battery fuel gauge requires proper programming to accurately indicate the battery’s charge status. Because of this, each iPhone battery generation has its own specific configuration.

The fake iPhone battery retains the programming for the iPhone 4’s battery, which is a designed capacity of 1420 mAh, using a bq27541 fuel gauge running version 1.25 firmware. The data inside it is often that of a used/recycled battery as well.

This data can be (partially) read out directly from the iPhone with a tool such as iBackupBot, but more data can be read if the battery is read with another tool. I have the EV2400 from Texas Instruments to read this out on a PC, but this data can be read out with a USB-to-TTL serial port, a logic gate (a logic inverter) and a small MOSFET transistor.

I created a small tool that uses this circuit to interface with the fuel gauge and read out its data. Check it out here.

Using my tool, this is the report for one of these fake batteries. Note how it is identified as an iPhone 4 battery. Don’t be fooled by the calculated state of health. It’s not accurate for this battery as the fuel gauge still thinks it’s still inside an iPhone 4 battery pack.


**** START OF HDQ BATTERY LOG REPORT ****
HDQ Gas Gauge Readout Tool version 0.9 by Jason Gin
Date: 9/30/2014
Time: 0:52:24
Serial port: COM26

Battery Identification
========================
DEVICE_TYPE = 0x0541, FW_VERSION = 0x0125, DESIGN_CAPACITY = 1420 mAh
Battery's configuration matches that of a standard iPhone 4 battery.

Basic Battery Information
===========================
Device = bq27541 v.1.25, hardware rev. 0x00B5, data-flash rev. 0x0000
Voltage = 3804 mV
Current = 0 mA
Power = 0 mW
State of charge = 45%
Reported state of health = 0%
Calculated state of health = 99.3%
Cycle count = 14 times
Time to empty = N/A (not discharging)
Temperature = 27.9 °C (80.3 °F) (3009 raw)
Designed capacity = 1420 mAh
Heavy load capacity = 628/1410 mAh
Light load capacity = 673/1455 mAh

Advanced Battery Information
==============================
Capacity discharged = 0 mAh
Depth of discharge at last OCV update = ~778 mAh (8768 raw)
Maximum load current = -200 mA
Impedance Track chemistry ID = 0x0163
Reset count = 11 times

Flags = 0x0180
Flag interpretation:
* Fast charging allowed
* Good OCV measurement taken
* Not discharging

Control Status = 0x6219
Control Status interpretation:
* SEALED security state
* SLEEP power mode
* Constant-power gauging
* Qmax update voltage NOT OK (Or in relax mode)
* Impedance Track enabled

Pack Configuration = 0x8931
Pack Configuration interpretation:
* No-load reserve capacity compensation enabled
* IWAKE, RSNS1, RSNS0 = 0x1
* SLEEP mode enabled
* Remaining Capacity is forced to Full Charge Capacity at end of charge
* Temperature sensor: External thermistor

Device name length = 7 bytes
Device name: bq27541

**** END OF HDQ BATTERY LOG REPORT ****

Reading out HDQ-equipped battery fuel gauges with a serial port

Battery fuel gauges are the unsung hero of the battery world. There’s more to it than just measuring the voltage on the battery terminals,. These little chips are microcontrollers (tiny computers, essentially) that sit inside the battery pack and keep tabs on the battery’s performance for the life of that battery pack.

Texas Instruments makes battery fuel gauges that are small enough to fit in the circuitry of a cell phone, and one of the most common ones that uses this technology are iPhone batteries. These batteries use a single-wire interface called HDQ (which stands for High-Speed Data Queue). It may sound similar to Dallas Semiconductors’ 1-Wire protocol, but the two are completely different and incompatible with each other.

Protocol details

The HDQ protocol can be emulated with a serial port and a little bit of external circuitry. The protocol can be emulated with a serial port at 57600 baud with 8 data bits, no parity bit and 2 stop bits. Because this is a bi-directional bus, an open-drain configuration is needed. Most TTL serial ports are not open-drain, so some circuitry is required to do this. TI’s application note suggests using a CMOS inverter and an N-channel MOSFET along with a 1 kOhm pull-up resistor, but this can be cut down with a 74HC07 open-drain buffer and pull-up resistor.

[EDIT: June 13, 2015 – Corrected schematic]

The HDQ protocol uses a short pulse to indicate a logic 1, with a longer pulse to indicate a logic 0. The data is sent LSB (least significant byte) first, with a 7-bit address and an eighth bit to indicate if the operation is a read or write (0 is read, 1 is write). If it is a read operation, the fuel gauge will respond with one byte of data. As you might think, this is a very slow means of communication; the typical bus speed is 5-7 kilobits per second, but the actual usable throughput will be less than this.

The hack in this is that the bit timing can be made by sending a specially crafted UART byte that meets the timing specifications. Each bit takes up one byte of UART buffer memory, with 24 bytes being enough to perform an HDQ read (the first 8 bytes are echoed back to the PC and need to be ignored by the software). TI’s application note goes into this with a bit more detail.

Windows HDQ utility

HDQ utility icon, in all its pixelated glory.

HDQ utility icon, in all its pixelated glory.

I have written a small Windows program that will read out the battery’s main data, identify as a certain iPhone battery model (most iPhone batteries are supported), and save a copy of this data to a text file for safekeeping. This program requires the National Instruments LabWindows/CVI Runtime library to run, since I whipped this program up with the first available IDE on my college PC.

fdd82eef8d

Screenshot of HDQ Utility version 0.96

The source code is not yet available (translation: I’m too ashamed of my programming skills to share it with others); however, a Windows executable is available for download below.

You will need to download the National Instruments LabWindows/CVI Runtime to run this program.

Current version (0.96): https://www.dropbox.com/s/pf0vszgfei7s8ly/HDQ%20Utility%200.96.zip?dl=0

Version 0.95: https://www.dropbox.com/s/7xdurbh9qibdftl/HDQ%20Utility%200.95.zip?dl=0
Version 0.9: https://www.dropbox.com/s/cd3esa5us6elfgr/HDQ%20Utility.zip?dl=0

Contributions are always accepted! Email me if you would like to send in a battery for me to analyze, or you can buy me a coffee through PayPal:


[EDIT – July 28, 2016] Welp, looks like the PayPal button’s broken (or was it never working to begin with…?). If you’d like to send anything to me, just give me a shout at ginbot86@gmail.com!

[EDIT – August 2, 2016] Whoops, looks like I never had the button working in the first place. Hopefully it works this time.


Mini-Ramble: I’m one of TI’s Community Members of the Month!

Yesterday I received a nice little email from The Texas Instruments E2E Community team. I was chosen as their Member of the Month of their analog electronics forum, specifically the battery fuel gauge section (of course!).

CaptureTI is sending me a Fuel Tank BoosterPack for their Launchpad microcontroller development platforms. It includes a 1200 mAh lithium-polymer battery, a bq27510 fuel gauge, and a bq24210 lithium-ion charger, all on one board. They’ve also offered me the opportunity to write a post on their power management blog, Fully Charged, regarding this little board. When I receive it I’ll definitely be taking a closer look at it.

Thanks, Texas Instruments!

Mini-Ramble: I’m such an icon artist!

After working so much with these battery chips, I thought I should spice up the Windows file icon for the .gg files that clutter my documents folder.

I’m not a person for glossy icons, but I’m also not a fan of the super-flat colour scheme that the Windows Metro UI uses. I prefer the good old style of Windows 9x-esque icons (hey, it’s what I grew up on! 🙂 ), albeit with a more… contemporary colour scheme. Keep it simple!

Windows .ico file download: https://www.dropbox.com/s/u7kjb3og7ecvpsj/gas%20gauge%20file.ico

You can use Nirsoft’s FileTypesMan to add an icon in Windows. Personally, I configured it so that .gg files open up in Notepad++ for manual editing.

Convenient chips, inconvenient packages: Making use of the Texas Instruments bq27421-G1 lithium-ion battery fuel gauge chip

As seen on Hackaday!

I ordered some sample chips from TI a few weeks ago, most of them being lithium-ion battery “fuel gauge” chips. These chips are used in electronic devices to determine exactly how much energy is in the battery, and if the chip’s sophisticated enough, provide a “time until empty” prediction.

The bq27421 from TI is packaged in a tiny 9-ball grid array, packaged as a wafer-level chip scale package (WLCSP). This means there is no epoxy covering like normal ICs, making for a compact design that’s a good thing for space-constrained applications like modern cell phones. I’ll talk about this chip later on in this post.

The tiny BGA package means that prototyping with these chips is difficult if not impossible, depending on how large the chip is that you’re working with. The bq27421 is about 1.6 mm x 1.6 mm, which is less than 1/3 of the size of a grain of rice. No way you’d be able to put that on a breadboard… right?

2013-06-14 15.51.58Well, you can, with a small breakout board, some magnet wire, epoxy (a bigger deal than you might initially think), patience and steady hands. I mounted the chips in what I call a mix between dead-bug (where the contacts face up as if the chip was like a dead bug on the ground) and chip-on-board construction (where the chip is glued directly to a board, wire-bonded and then covered in epoxy). I used some SOIC-to-DIP boards from DipMicro Electronics (link). I often use these boards when doing work on prototyping board since using these surface-mount parts reduce the board’s height compared to using actual DIP packaged chips (which are much less common for modern ICs anyway).

The chip is first affixed to the breakout board using a small amount of epoxy and allowed to cure for several hours. The epoxy, from what I’ve found, is crucial to your success; superglue and other adhesives won’t stand up to the heat of a soldering iron, and if it loosens you can end up ruining your chip and wasting your time spent working on it.

After letting the epoxy cure, I then prepare the bond pads around the chip. I place a liberal amount of solder on each pad to allow easy connection with the iron later; I want to minimize the stress on the tiny 40-gauge magnet wire because once the connection is made, the solder ball that the chip came with won’t be as easy to solder to the second time around.

Next up is the actual soldering process. I created a pinout for the board in PowerPoint to help plan out how I’ll solder the wires. After tinning a long length of 40-gauge magnet wire, I then solder the wire first to the solder ball on the chip, then solder the other end to the pad I previously put solder on. To minimize the stress on the wire afterwards, I use a small utility knife to cut the end of the wire where the pad is. I then complete this for the rest of the contacts. This took me an hour and a half the first try, but took me about 20 minutes the second time around. Also, for my second try, for the BAT and SRX pins, which carry the full current for any loads connected, I used 30-gauge wire-wrapping wire to allow a bit more current-carrying capacity. It probably is overkill since the maximum current rating for the bq27421 is 2 amps continuous, but I felt a bit more at ease connecting the pins this way.

After checking for short and open circuits with a multimeter I then placed headers onto the board and put it into my “evaluation board” that I created just for this chip. Using an EV2400 box from TI, used to connect to their vast range of battery-management chips, I connect the box to my PC and run their GaugeStudio software to verify that the chip works.

… and it does, like a charm! I was able to communicate with the chip and also view its operation in real-time.

One thing that was causing me trouble before was that after removing the battery and putting another one in, I found that the gauge chip sometimes wouldn’t be recognized by the PC. Being unsure why it was doing this, I dug through the reference manual, and found one tiny part in the manual that showed me why it wasn’t working consistently.

gpoutThe GPOUT pin was left floating on my board, and the chip requires a logic high signal before it starts up. This brings back memories of my digital electronics class in college; these floating inputs can cause all sorts of trouble if you’re not careful, and in this case, it was mentioned only once in the reference manual. After using a 1 megohm resistor to pull up the pin, the chip worked flawlessly. Now that I verified that the chip was working, I mixed up some more epoxy and covered the chip, making sure that the bond wires and chip were covered to prevent damage.

After all that, I had a couple working highly-advanced battery gauges that I could fool around with, and also learned a couple things about deadbugging SMT components and also the basics of chip-on-board construction.