Review of XTAR Li-ion 4150mWh AA / 1200mWh AAA batteries and L8 USB-C 8-bay charger

TL;DR: XTAR’s new lithium-ion AA and AAA batteries offer a decent alternative to Ni-MH rechargeables if weight and/or output voltage is a concern, but only for low- and medium-drain applications. You can charge them directly with 5V if you don’t have a dedicated charger on hand. Their new L8 charger works for their Li-ion 1.5V batteries and third-party Ni-MH cells alike.

XTAR's 4150mWh AA, and 1200mWh AAA Li-ion batteries in an XTAR L8 USB-C charger.

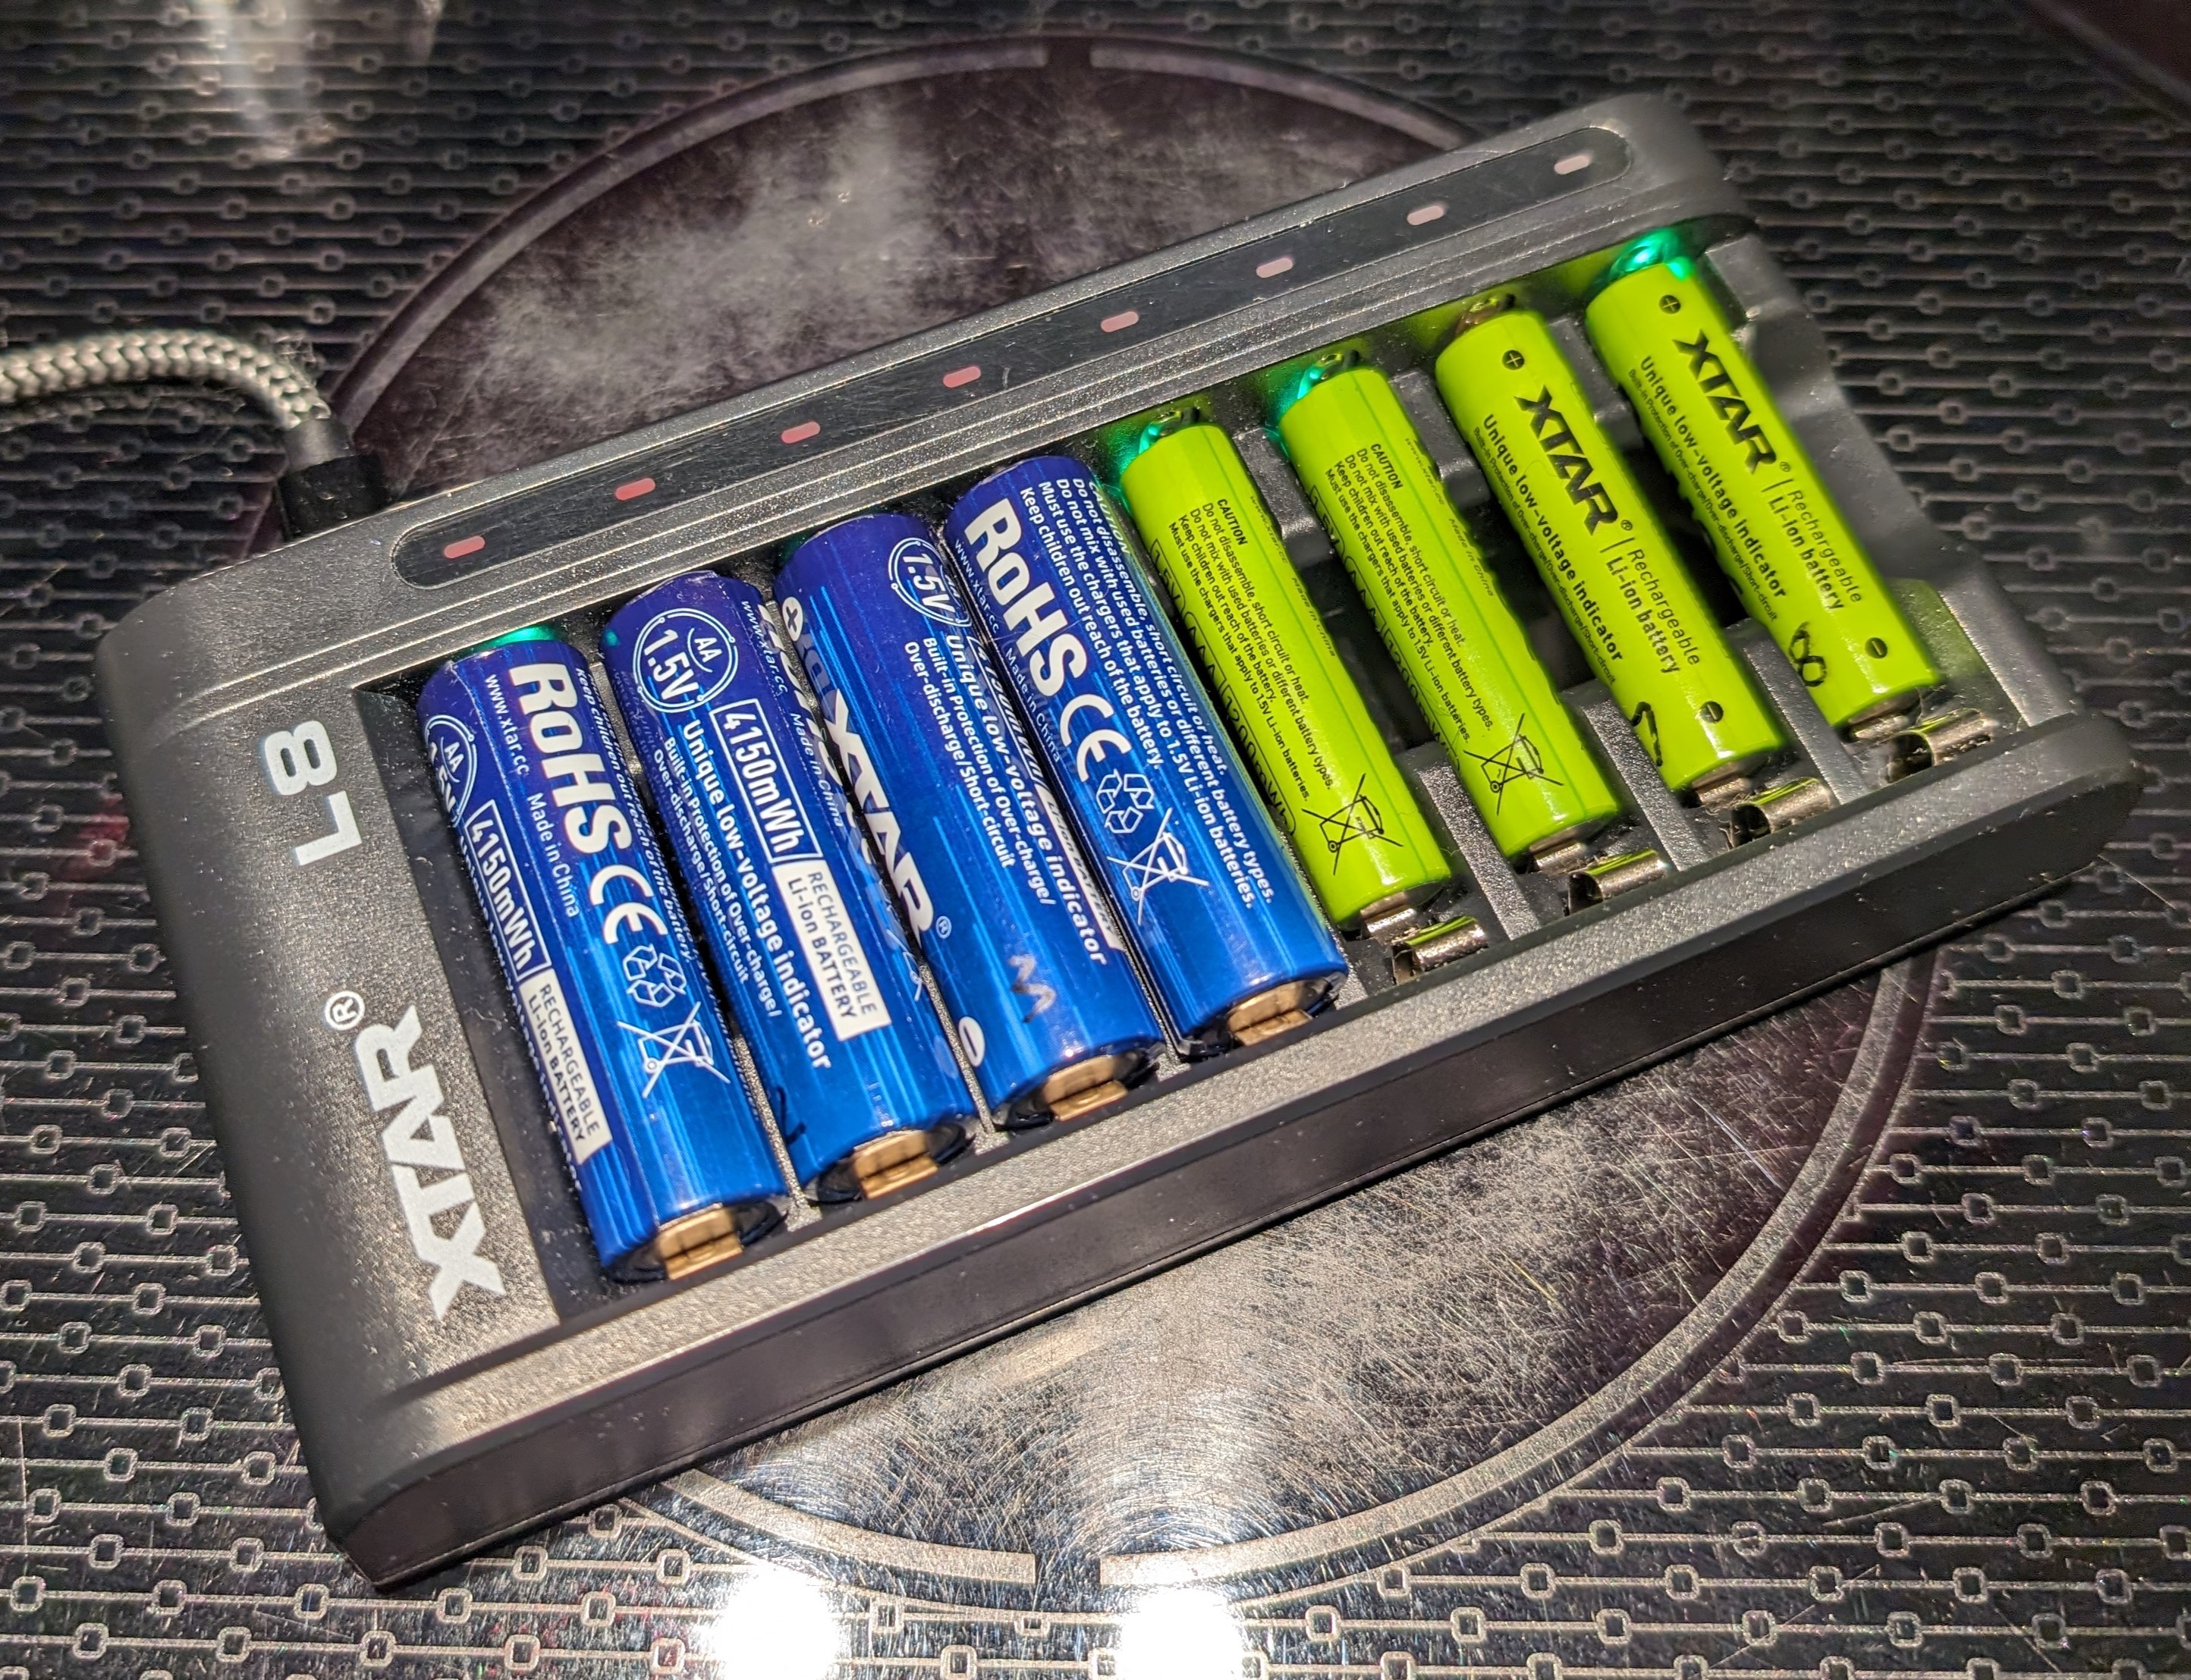
XTAR’s 4150mWh AA, and 1200mWh AAA Li-ion batteries in an XTAR L8 USB-C charger.

Lithium-ion AA and AAA batteries have been around for several years (see this review of the Kentli PH5 I made several years ago), but that doesn’t mean they haven’t made progress in energy density. Last summer, XTAR offered me a bundle of their latest and highest-capacity AA and AAA Li-ion batteries to try out, alongside their latest L8 multi-chemistry 8-bay charger. After several months of testing, I have collected enough data on which to base my review upon.

FULL DISCLOSURE: XTAR provided these batteries and corresponding charger to me at no charge for an independent review. They had no editorial control over this review, I have not been compensated monetarily, and all opinions expressed in this review are my own.

Introduction

XTAR is no stranger to the world of lithium-ion rechargeable batteries, and their new Li-ion 1.5V AA and AAA batteries offer an incremental improvement to their previous offerings, increasing their AA batteries from 3.3 watt-hours to 4.15 watt-hours of energy, and their 1.2 watt-hour AAA batteries enjoy a small performance boost from 1.5 amps to 1.6 amps of maximum continuous discharge current.

Like all Li-ion 1.5V batteries that use a DC-DC converter internally to regulate the nominal 3.7 volts from the internal cell down to 1.5 volts, XTAR’s AA/AAA batteries feature a flat discharge profile irrespective of load current and state of charge; their better offerings will even reduce their output voltage from 1.5 to 1.1 volts when the batteries near empty, helping to signal to the device they’re installed in that a recharge will soon be necessary; without this feature, a powered device will “think” it’s perpetually at 100% charge until it suddenly turns off.

Some Li-ion 1.5V batteries include charge regulation circuitry internally, which makes charging them easier since you can provide 5 volts from USB power to directly charge them. Some have a (micro-)USB or USB-C port to do this, but at the expense of battery capacity due to the physical space they take up. XTAR gets around this by including a linear charge controller in the positive end cap of the battery, but allows charging by feeding 5 volts into the same terminals used to discharge them. This makes DIY charging of their batteries easy, if one doesn’t want to spend extra for a dedicated charger. That said, the XTAR L8 charger offers multi-chemistry support, charging their Li-ion AA/AAAs as well as your existing Ni-MH cells. You don’t even need to group them by chemistry, as each charge bay is controlled independently – mix your cells to your heart’s content (just not in your device!). If you’ve already converted most of your USB charging gear to USB-C, you’re in luck – the L8 not only supports USB-C adapters with the correct 5.1k pulldown resistors, it supports requesting higher voltages (specifically, 9 volts) using Quick Charge 2.0 over the data pins for faster charge times (something I was unable to quantify since I don’t have enough test equipment on hand).

Battery Tests

For my discharge tests, I used my SkyRC MC3000 multi-chemistry battery analyzer, which was calibrated against my Keysight U1253B multimeter for both voltage and current measurements. Charging the batteries was performed using the L8 charger that XTAR provided me, as the MC3000 doesn’t support charging batteries with integrated charge regulation circuitry. Thermal performance was measured using an Inifiray P2 Pro thermal camera. The results of four cells were averaged together to get the data shown below.

I included tests of Ikea Ladda 2450mAh Ni-MH AA batteries as a means of comparing the performance of XTAR’s Li-ion technology against existing Ni-MH batteries, with the Ladda effectively being a rebrand of Panasonic’s Eneloop low-self-discharge Ni-MH battery.

AA Capacity vs. Load

Testing the battery capacities with varying load currents revealed a “humped” curve reminiscent of my PH5 review; that is, there is a “sweet spot” where the extracted capacity is highest, rather than a simple downward slope for batteries that don’t use an internal DC-DC converter.

Chart showing the XTAR 4150mWh Li-ion AA's capacity at different load currents.

Chart showing the XTAR 4150mWh Li-ion AA’s capacity at different load currents.

The AA battery showed a peak of 2353mAh at 500mA, which might sound like it’s just under the Ladda’s capacity, but things change once we compare the amount of energy that each battery delivers.

XTAR 4150mWh Li-ion AA vs. Ikea Ladda 2450mAh Ni-MH AA

Chart comparing extracted energy from XTAR 4150mWh Li-ion AA vs. Ikea Ladda 2450mAh Ni-MH AA.

Chart comparing extracted energy from XTAR 4150mWh Li-ion AA vs. Ikea Ladda 2450mAh Ni-MH AA.

For these low to moderate loads, the XTAR AA comes out on top, mainly helped by its higher output voltage. This trend only holds true for the load range that the XTAR battery supports, though. Once you need a battery that can support heavier loads, then a high-drain capable Ni-MH battery is your only real option (but given its capacity-vs-load characteristic, it should provide more consistent performance irrespective of load current).

Now, in terms of the above data… I did have to smooth some numbers due to missing energy values, thanks to a bad data collection setup for some earlier data runs; to be more precise, I multiplied the capacity values with a nominal voltage to get the outputted energy values. However, the data trend itself remains the same.

AAA Capacity vs. Load

The AAA batteries have a similar curve to the AAs, but peak at a lower discharge rate relative to its rated maximum discharge current. I didn’t have an equivalent AAA Ni-MH to test against.

Chart showing the XTAR 1200mWh AAA Li-ion battery's capacity versus load current.

Chart showing the XTAR 1200mWh AAA Li-ion battery’s capacity versus load current.

XTAR 1200mWh AAA Energy vs Load

Chart showing the XTAR 1200mWh AAA Li-ion battery’s energy versus load current.

The equivalent nominal voltage is different for the AAA as it decreases to its 1.1V low-battery threshold much later than the AA does. However, its peak energy percentage is also slightly higher than the AA’s but both are in the mid-80% range.

Thermal Performance

Thermal capture of the XTAR 4150mWh AA Li-ion battery at maximum load.

Thermal capture of the XTAR 4150mWh AA Li-ion battery at maximum load.

One potential concern I have with the batteries is just how hot the regulator circuitry at the positive end gets when under heavy loads. While the AA battery is rated for 2 amps of continuous discharge current, the positive end of the battery reached upwards of 80 or 90 degrees Celsius, hot enough to distort the plastic label from the sustained heat. This ultimately isn’t unique to XTAR’s offerings (the Kentli PH5 I previously tested ran into the same issues at high loads), but is still something to be aware of when using these batteries in high-drain devices, especially ones that place a constant load on the battery. The AAAs aren’t quite as affected but still reached temperatures of almost 60 degrees Celsius at maximum rated load.

Thermal capture of XTAR L8 while charging four Ikea Ladda 2450mAh Ni-MH AAs, and four XTAR 4.15Wh Li-ion AAs.

Thermal capture of XTAR L8 while charging four Ikea Ladda 2450mAh Ni-MH AAs, and four XTAR 4.15Wh Li-ion AAs. Note the heat generated at the positive terminal.

In terms of charging, the thermal issue remains but is much smaller. Heating of the positive end circuitry is largely unavoidable due to the use of a linear charge controller (but can you really expect to fit a switched-mode charger in the end cap of an AA/AAA battery?), with peak temperatures just under 50 degrees Celsius. This isn’t terribly hot compared to the peak temperature of a Ni-MH battery near the end of its charge cycle, which in the above image was about 40 degrees Celsius at the time of capture.

Charger Test (Ni-MH Charging)

I was curious as to how the L8 handles Ni-MH charging, so I captured the voltage and currents going into an Ikea Ladda 2450mAh cell with some jerry-rigged AA battery adapters and an AVHzY CT-3 USB meter.

Chart showing the voltage/current of the XTAR L8 while charging an AA Ni-MH cell.

Chart showing the voltage/current of the XTAR L8 while charging an AA Ni-MH cell.

The L8 charges at about 480mA but takes a small pause every 2 seconds to sample the cell’s voltage. Although I can’t say for certain, a zoomed-out look at the test data suggests that the L8 is uses the -dV/dt (voltage sag over time) method to determine when the cell is fully charged.

Conclusion

Overall, I’m quite satisfied with the batteries and charger. While the idea of sticking DC-DC converters inside a small battery case comes with limitations, it can still offer performance benefits for many applications.

Battery Pros

  • Higher output voltage than Ni-MH
  • Higher energy density than Ni-MH (within specified current range)
  • Low-voltage feature drops the output from 1.5 to 1.1 volts when battery runs low
  • Integrated charge circuitry allows batteries to charge directly from 5 volt power (DIY charging is easy)
  • Lack of USB charge port means no space lost to a USB port (therefore, more battery capacity)

Battery Cons

  • Integrated DC-DC converter limits efficiency
  • Heat generation at high loads due to DC-DC converter when discharging, and linear charge regulator when charging
  • Lower maximum discharge current compared to Ni-MH

Review and analysis of XTAR 3600 mAh 18650 Li-Ion protected battery

TL;DR – Yes, the XTAR 3600 mAh protected 18650 battery meets its rated capacity! Just make sure your device can drain down to 2.5 volts.

The 18650 lithium-ion battery, named after its size (1.8 cm diameter and 6.50 cm length), has seen continuous improvements in capacity over the years. Nowadays it’s easy to get capacities in excess of 3000 mAh, with the highest capacity cells reaching and even exceeding 3500 mAh.

The XTAR 3600mAh protected 18650 lithium-ion battery, pictured with its original box.

The XTAR 3600 mAh protected 18650 lithium-ion battery, pictured with its original box.

Earlier this year, XTAR, a Chinese company specializing in batteries and battery accessories, announced the newest and highest-capacity addition to their protected 18650 lineup, boasting an impressive 3600 mAh capacity and aimed towards medium-drain applications like power banks and LED flashlights (sorry vapers, this one’s not for you!). After submitting my name for consideration, I was one of a few people selected to receive some samples for review; considering how much I’ve blogged about lithium-ion batteries on here, it only makes sense to talk even more about them!

FULL DISCLOSURE: XTAR provided these batteries to me at no charge for an independent review. They had no editorial control over this review, I have not been compensated monetarily, and all opinions expressed in this review are my own.

Introduction

XTAR’s new 3600 mAh protected 18650 comes in a discreet box, holding nothing more than the battery itself. Like all protected 18650s, the protection comes in the form of a small PCB (printed circuit board) that is stacked on the negative end of the bare 18650 cell, with a metal strap running up the cell’s body to the positive terminal, where a small “button top” is attached to improve electrical connectivity for spring-loaded battery holders.

Positive and negative terminals of the XTAR 3600mAh protected 18650 battery.

Positive and negative terminals of the XTAR 3600 mAh protected 18650 battery. Note the added length due to the button top on the left, and the protection circuit and protective plate on the right.

I was able to request an official datasheet for the battery, which I have included at the end of my blog post. My main goal with this review is to test the batteries from an objective perspective, using dedicated test equipment rather than in-application testing in devices like flashlights. If I do decide to perform such tests, I’ll add a second part to my review (stay tuned!).

Datasheet specifications

Parameter Value
Cell manufacturer (Unspecified)
Nominal voltage 3.6 V
Nominal capacity 3600 mAh
Minimum capacity 3500 mAh
Discharge cutoff voltage 2.5 V
Cycle life @ 80% capacity At least 300 times
(0.5C charge to 4.2 V, 0.03C taper; 0.5C discharge to 2.5 V)
Size 18.1~18.7 mm diameter
68.3~69.3 mm length
Weight ≤50 g
Internal AC resistance ≤45 mΩ
Standard charge CC 720 mA
CV 4.2 V
Taper 50 mA
Fast charge CC 2500 mA (0.7C)
CV 4.2 V
Taper 36 mA (0.01C)
Standard charge voltage 4.2 V
Standard discharge 720 mA CC to 2.5 V
Continuous discharge current >8.5 A
Overvoltage protection Trip 4.25~4.35 V
Recover 4.0~4.2 V
Undervoltage protection Trip 2.4~2.5 V
Recover 2.8~3.0 V
Overcurrent protection Trip 11~13 A
Working temperature Charging: 0~45 °C
Discharging -20~60 °C

Test 1: EBL TC-X Pro battery analyzer

Initial testing of the batteries was tested using my EBL TC-X Pro 4-bay battery analyzer. The test procedure for the batteries was performed as follows:

  1. Record out-of-box/initial voltage before charging
  2. Run automatic capacity test with programmed 1500 mA charge current to 4.2 V, and fixed 500 mA discharge to 2.75 V (charge -> discharge -> charge); record discharge capacity and reported internal resistance
  3. Run manual discharge test with fixed 500 mA current to 2.75 V; record discharge capacity and reported internal resistance
  4. Run manual charge with 1500 mA charge current to 3.65V/LiFePO4 mode (moderate voltage is best for long-term storage); record charge capacity
Parameter (charge current = 1.5A) Cell 1 (bay 1) Cell 2 (bay 2)
Initial voltage (V) 3.65 3.55
Capacity run 1 (mAh @ 2.75 V end of discharge) 3349 3369
Capacity run 2 (mAh @ 2.75 V end of discharge) 3334 3386
Internal resistance run 1 (mΩ) 54.9 46.9
Internal resistance run 2 (mΩ) 53.4 45.1
Storage capacity (mAh charged to 3.65 V) 1402 1494

The capacity numbers seemed a bit low to me, even for an incomplete discharge to 2.75 volts instead of 2.5 volts. I decided to continue testing with a more accurate (and calibratable) battery fuel gauge board, revealing the true capacity of this battery… and it’s as good as the manufacturer promised!

Test 2: Texas Instruments bq78z100 fuel gauge

After realizing that my dedicated battery analyzer wasn’t quite as accurate as I wanted, I decided to use a battery fuel gauge board that I had more confidence in. I had previously built a board based on the Texas Instruments bq78z100, a dedicated battery management system (BMS) on a chip, aimed at 1S and 2S battery packs. This allowed me to calibrate the voltage and current measurements against my Agilent/Keysight U1253B multimeter and therefore get the most accurate results, as I can also program the bq78z100’s autonomous protection features to provide precise control over the discharge cutoff voltage during testing.

Example of the bq78z100-based fuel gauge board being connected to the XTAR 3600mAh protected 18650 battery. (note: actual setup is different than as pictured)

XTAR 3600 mAh protected 18650 battery connected to the bq78z100-based fuel gauge board. (note: actual setup is different than as pictured)

Using this circuit, I was able to get multiple measurements of the battery’s capacity with the help of a Texas Instruments GDK (Gauge Development Kit) as a charger and adjustable load for some of the capacity tests; and an Arachnid Labs re:load 2 adjustable constant-current load, with some additional forced-air cooling for the higher discharge rates.

I suspect that if I had a more, erm, “professional” setup, I could extract even more capacity from the battery, as additional resistance between the battery and the fuel gauge board will cause a voltage drop and subsequent loss in measured capacity.

Available capacity vs. end-of-discharge voltage

This is one of the most interesting test results, in my opinion. Many 1S/”single-cell” devices can’t take full advantage of modern NMC (nickel-manganese-cobalt) cells whose end-of-discharge voltage is below 3 volts, and the following chart helps quantify how much capacity can be extracted if one stops earlier than that. One advantage of reducing the depth of discharge, however, is that it can extend the battery’s cycle life and reduce the amount of capacity loss it experiences with age. As long as you discharge all the way to 2.5 volts and at a modest rate, the XTAR 3600 mAh battery achieves its rated capacity, and then some!

Chart plotting the XTAR 3600mAh protected 18650's voltage, compared to discharge capacity and discharge rate.

XTAR 3600 mAh protected 18650’s voltage/capacity curves at various discharge rates. (click here for full-size chart)

Discharge Rate Capacity/DoD@ 3.3V
(Rel/Abs)
Capacity/DoD @ 3.0V
(Rel/Abs)
Capacity/DoD @ 2.75V
(Rel/Abs)
Capacity/DoD @ 2.5V
(Rel/Abs)
C/10
(350 mA)
2616 mAh
72.4%/72.4%
3357 mAh
92.9%/92.9%
3539 mAh
97.8%/97.8%
3613 mAh
100%/100%
C/5
(720 mA)
2555 mAh
(N/A)/70.7%
3250 mAh
(N/A)/90.0%
(No Data) (No Data)
C/2
(1800 mA)
2310 mAh
67.2%/64.0%
3076 mAh
89.4%/85.1%
3338 mAh
97.1%/92.3%
3438 mAh
100%/95.2%
1C
(3600 mA)
1995 mAh
57.2%/55.2%
2874 mAh
82.4%/79.5%
3330 mAh
95.5%/92.2%
3486 mAh
100%/96.5%

Note that “relative” and “absolute” percentages correspond to the 2.5 volt discharge values for each row and the C/10 rate, respectively. The curve for the C/5 discharge rate ends early, as that data was collected with my Texas Instruments GDK (Gauge Development Kit), which has a hardcoded discharge cutoff at 2.9 volts. One oddity of the 1C curve is how it actually gets slightly more capacity than the C/2 rate; I suspect this is because the internal resistance of the battery was decreasing due to cell heating, allowing the lithium ions to travel across the cell’s separator more easily. Additionally, the capacity under-reporting issue I was having with the EBL tester is more visible in this chart, since a rough extrapolation would bring the discharge curve at 500 mA around 3550 mAh, which is a fair amount higher than the measured ~3340 mAh. If I have the time to recollect some data, I’ll add it to the chart.

Thermal performance

I don’t have the equipment to test beyond a 1C discharge rate, but even at a C/2 discharge rate I noticed significant heating of the battery; nothing disconcerting but still noteworthy. At 1C, the temperature rose to just over 40 degrees Celsius (104 degrees Fahrenheit) by the end of the discharge cycle – definitely warm to the touch but not burning hot. However, I imagine that a discharge rate at 2C or even higher will result in battery temperatures exceeding 50 degrees Celsius (122 degrees Fahrenheit), hot enough to be uncomfortable to hold. Note that lithium-ion batteries should not be charged if they are warmer than 45 degrees Celsius (113 degrees Fahrenheit).

Chart plotting the XTAR 3600mAh protected 18650's temperature, compared to discharge capacity and discharge rate.

XTAR 3600 mAh protected 18650’s temperature curves at various discharge rates. (click here for full-size chart)

Chemistry analysis

After running the data taken at a C/10 discharge rate through TI’s online tool, GPCCHEM, I was able to get two chemistry IDs that would allow me to get an accurate model of the cells for use in their Impedance Track line of fuel gauges.

Chemistry ID (hex) Chemistry Description Cell match Max DoD error (%) Max Ra deviation ratio
5267 LiMn2O4 (Co,Ni)/carbon, 4.2 V Bak: N18650CP (3350 mAh) 2.3 0.27
5634 LiMn2O4 (Co,Ni)/carbon, 4.2 V NanoGraf: INR-18650-M38A (3800 mAh) 2.72 0.61

Don’t pay too much attention to the details; they are provided for informational purposes only and mainly of use for those that want to use these batteries with TI’s fuel gauge chips. The specific models listed are not a guarantee that these batteries actually are that cell model, but it does confirm that our data is otherwise trustworthy; both listed models are high-capacity cells and use a chemistry system containing nickel, manganese, and cobalt (NMC for short), and such chemistries tend to have a relatively high capacity at the expense of lower terminal voltage (3.6 V nominal, 2.5 V at end of discharge; versus the typical 3.7 V nominal and 3.0 V end of discharge).

Conclusion

After my testing, I can confidently say that XTAR’s 3600 mAh 18650 really does achieve its rated capacity. As long as your target device is capable of discharging to 2.5 volts and at a modest rate, it will be able to get the most out of this battery.

If you want to purchase this battery, you can do so from their online store: https://xtardirect.com/products/18650-3600mah-battery?VariantsId=10393

At the time of writing, XTAR is selling this battery at $11.90 USD for a single battery, or $23.80 USD for a two-pack with carrying case.

Downloads

The datasheet for the battery can be found here: https://www.dropbox.com/s/wibdm2ty6zfa7xo/XTAR%2018650%203600mAh%20Specification.pdf?dl=1

Unboxing and review of SanDisk 64GB microSDXC High Endurance Card

UPDATE (July 19, 2020): I’ve analyzed a 128GB version of the High Endurance card, and it appears that SanDisk is using 3D TLC Flash.

Dashcams: they can be a crucial tool when reconstructing events in a vehicular incident, or a source of entertainment when watching compilations on YouTube. Like any modern device, they generally use SD or microSD cards as their storage medium. However, not all cards are created equal.

Cheaper cards, like SanDisk’s Ultra lineup, use cheaper TLC (triple-level cell) NAND Flash that is ill-suited to the harsh working conditions of a dashcam. Not only does the card have to endure temperature extremes, the constant writes can burn through the Flash’s write cycles in short order. In fact, SanDisk specifically denounces this line of cards for use in continuous-recording applications.

The solution: high-endurance memory cards! These cards (at least in theory) use more durable MLC or even SLC NAND Flash, which can take many more write cycles. I purchased the 64-gigabyte model, the SDSQQNR-064G-G46A.

Unboxing

The card’s packaging isn’t much different than SanDisk’s typical microSD card offerings. The paper-and-plastic package includes a small blister pack that holds the microSD card itself and the full-size SD card adapter, without a carrying case (granted, the memory card is expected to stay inside the dashcam for most of its working life).

The packaging also includes a license key for a 1-year subscription to the RescuePRO data recovery software (although in all honesty, you’d be better off using the free PhotoRec software instead).

Endurance Rating

SanDisk’s lineup of high-endurance memory cards are designed for use in very write-intensive workloads, such as constant video recording.

Unfortunately, the endurance specifications for these cards are (probably intentionally) vague, only providing a set number of hours of video recording. However, we can infer a rating with a little bit of math.

SanDisk’s card packaging defines Full HD video to be 26 Mbps, which is equivalent to 3.25 (binary) megabytes per second. This equates to 11,700 megabytes per hour, or 11.426 gigabytes per hour. With a rating of 5,000 hours at this data rate, we get a specified endurance of 57,128.91 gigabytes written, or 55.79 terabytes written (TBW).

Memory cards, like other block-based storage media, often define capacities with decimal prefixes, whereas computers usually binary. A “64-gigabyte” card is really 59.605 binary gigabytes (“gibibytes“) in capacity, but in this blog post I’m using the Windows notation of gigabytes; that is, calculating in binary but displaying as decimal. 😛

Therefore, we get a final calculated P/E (program-erase) cycle count of… 936 cycles. This is more in line with traditional 2D TLC NAND Flash, so I suspect that this rating is either based on different bitrates, or SanDisk is being really, really conservative in their estimates – or heck, maybe this really is just TLC NAND Flash that’s being configured and/or warrantied differently by SanDisk. As much as I am tempted to remove the epoxy coating that covers the manufacturing test pads in order to get a NAND Flash signature directly, I like having a warranty for at least a few years. Maybe I’ll buy another card to try this on…

UPDATE (July 19, 2020): I got my paws on another card (the 128GB variant), and did some reverse-engineering work on it to determine what Flash SanDisk used. It turns out they used 3D TLC NAND, which is still quite durable and reliable due to the use of larger process geometries. The Flash should easily withstand thousands of write cycles without much issue.

Card Information

Using an older laptop with a true SD-compliant slot (most newer ones are just USB card readers internally), I was able to grab the card’s metadata from Linux. These information files are found in /sys/block/mmcblkX/device, where X is usually 0 depending on your host machine. Android used to be able to do this as well, but nowadays it’s not possible without a rooted operating system.

Item Value
CID (Card ID) 035744534836344780ed1bbb9e013100
CSD (Card Specific Data) 400e0032db790001dbd37f800a404000
Manufacturer ID 0x03 (SanDisk)
Manufacture Date January 2019
Device Name SH64G
Firmware Version 0x0
Hardware Revision 0x8

Initial Formatting

The card is formatted as exFAT, with a 16 MB offset (that is, the first 16 MB of the card is unallocated), with an allocation unit size of 128 kilobytes. It uses a very basic MBR (Master Boot Record) partition structure, with the first sector being the bare minimum to be recognized as a valid structure.

Performance

Now that I’ve probably irked some of my readers with my usage of decimal and binary prefixes, it’s time to see how fast this card can go. SanDisk’s own ratings for the card are very brief, citing a sequential read/write speed of 100 and 40 MB/s respectively. It is rated for the V30 Video speed classification, which guarantees a minimum of 30 MB/s sequential writes continuously.

All the tests below were performed on my desktop computer using a FCR-HS4 USB 3.0 reader from Kingston, which is based on the Realtek RTS5321 chipset.

CrystalDiskMark

CrystalDiskMark is the de-facto standard for storage benchmarks. I’m using the 64-bit edition of CDM, version 5.2.0.

I/O Type Read Write
Sequential QD32 91.80 MB/s 60.56 MB/s
Sequential 93.33 MB/s 61.66 MB/s
4K Random QD32 8.319 MB/s
2129.7 IOPS
4.004 MB/s
1025.0 IOPS
4K Random 8.121 MB/s
2079.0 IOPS
3.971 MB/s
1016.6 IOPS

The sequential I/O speeds are on par with a modern microSDXC card, and the IOPS aren’t too shabby either; they exceed the IOPS requirements for the A1 performance class which requires R/W IOPS of 1500 and 500 respectively. This could make this type of card a viable option for other write-heavy environments – this includes single-board computers (SBCs) like the Raspberry Pi, where memory card failures due to excessive writes are common.

ATTO Disk Benchmark

The card’s read/write performance levels off at around the 64-kilobyte mark during testing, showing that operations smaller than this incur a significant performance penalty. This may also be indicative of the internal page and block sizes of the NAND Flash itself.

Hard Disk Sentinel

Hard Disk Sentinel comes with a bunch of disk benchmarking tools, including some to test the entire “surface” of a drive. I used the software’s Surface Test tool to measure the card’s performance before and after filling the drive with data – first with random data, then with all zeroes.

Random Seek Test

The Random Seek Test measures the card’s latency when performing random “seeks”, although more accurately it reads a single sector from a random location.

State Average Latency Minimum Latency Maximum Latency
Empty/Initial (0x00) 360 µs 350 µs 420 µs
Random Fill 600 µs 590 µs 670 µs
Zero Fill 600 µs 590 µs 690 µs

The card initially had about 420 microseconds of latency, but after filling the card with random data, this increased to 670 microseconds. Filling the card with all zeroes again did not improve performance, and his isn’t helped by the fact that SD cards generally lack the ability to “TRIM” unused sectors like SSDs or eMMC chips.

Full Surface Read (or at least an attempt)

This is where things get a bit… interesting. It was around this time that I noticed some performance inconsistencies that didn’t show up on other benchmarks. Although the I/O speeds largely matched what my other benchmarks revealed, I noticed frequent dips below normal, often down to the mid-20 MB/s range! I wasn’t sure that this was necessarily the card’s fault (pauses in read/writes could result in performance degradation on a device if it can’t buffer the writes well enough), or if my card reader/operating system/etc. was responsible.

I decided to hold off on publishing the sequential write test until I get this issue figured out – perhaps it’s worthy of a blog post all on its own…