TL;DR – Yes, the XTAR 3600 mAh protected 18650 battery meets its rated capacity! Just make sure your device can drain down to 2.5 volts.
The 18650 lithium-ion battery, named after its size (1.8 cm diameter and 6.50 cm length), has seen continuous improvements in capacity over the years. Nowadays it’s easy to get capacities in excess of 3000 mAh, with the highest capacity cells reaching and even exceeding 3500 mAh.

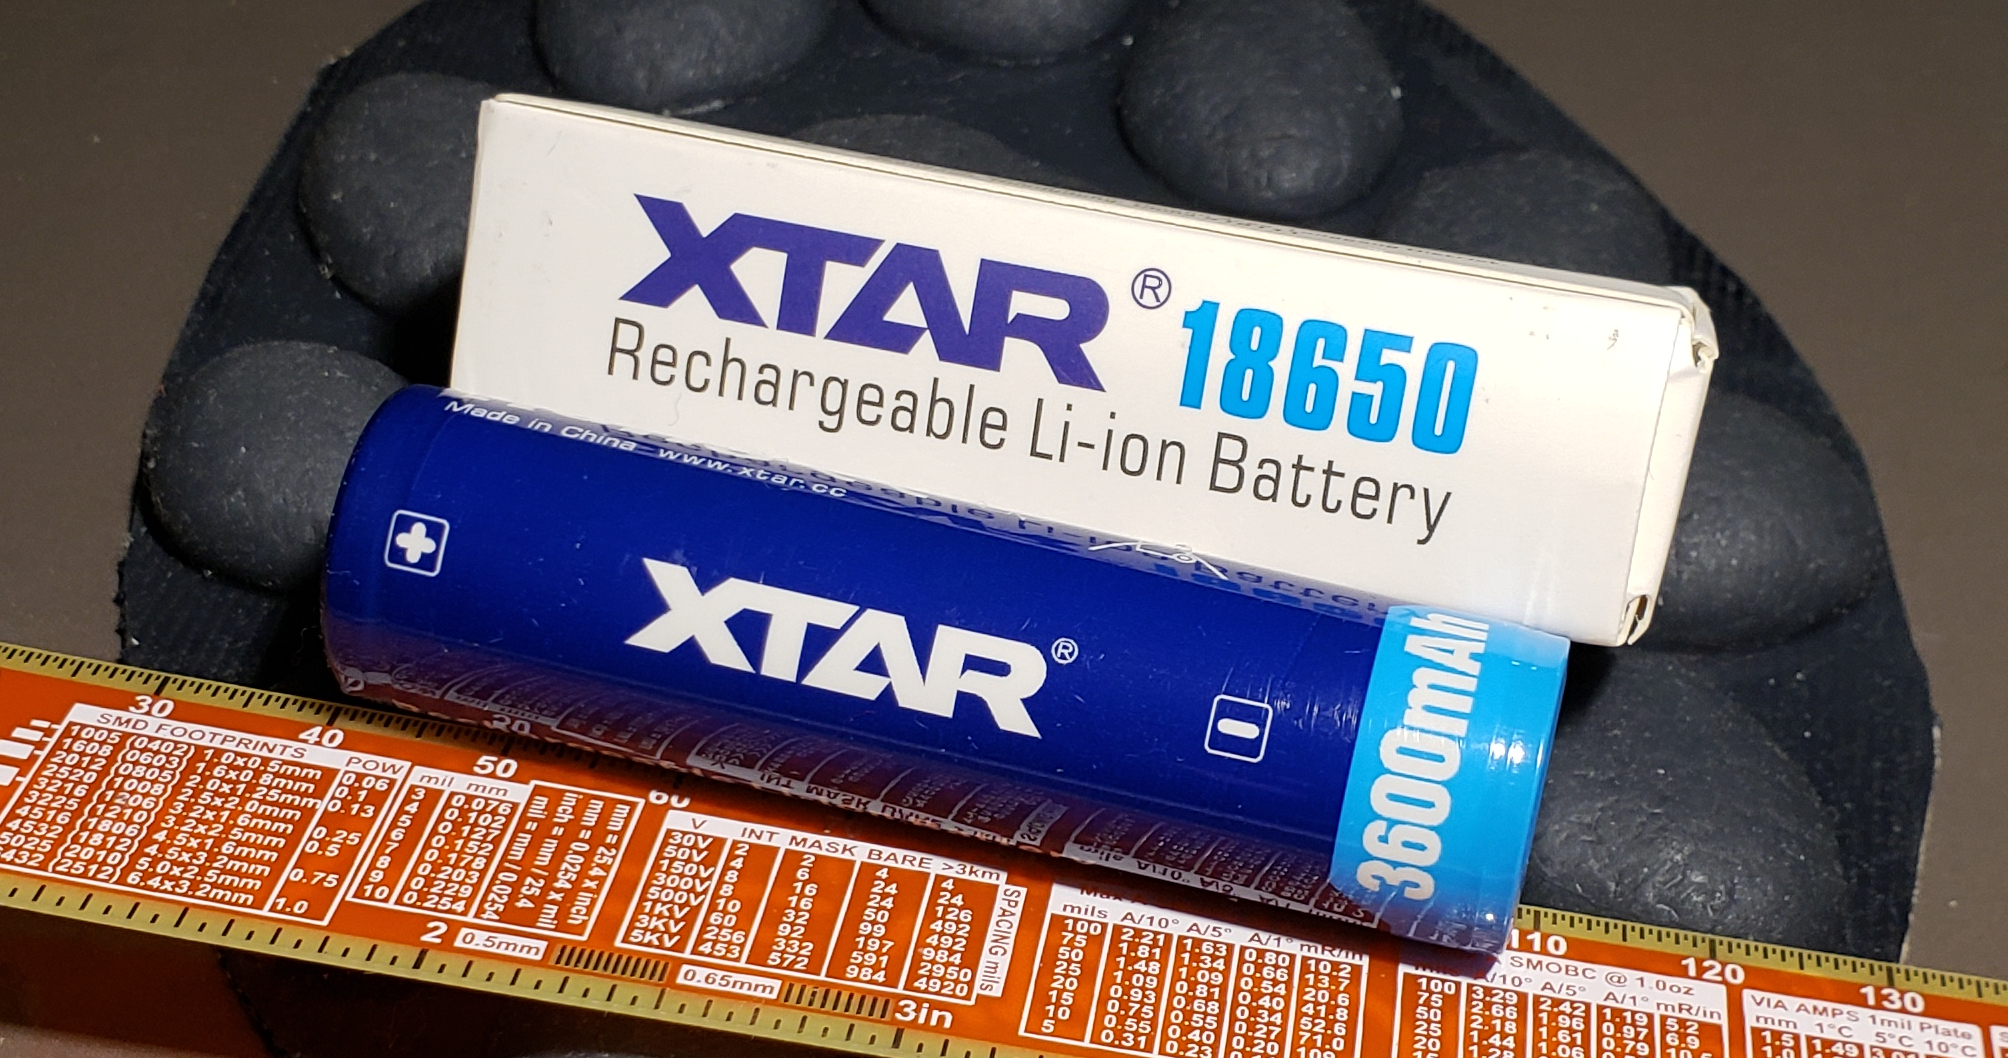
The XTAR 3600 mAh protected 18650 lithium-ion battery, pictured with its original box.
Earlier this year, XTAR, a Chinese company specializing in batteries and battery accessories, announced the newest and highest-capacity addition to their protected 18650 lineup, boasting an impressive 3600 mAh capacity and aimed towards medium-drain applications like power banks and LED flashlights (sorry vapers, this one’s not for you!). After submitting my name for consideration, I was one of a few people selected to receive some samples for review; considering how much I’ve blogged about lithium-ion batteries on here, it only makes sense to talk even more about them!
FULL DISCLOSURE: XTAR provided these batteries to me at no charge for an independent review. They had no editorial control over this review, I have not been compensated monetarily, and all opinions expressed in this review are my own.
Introduction
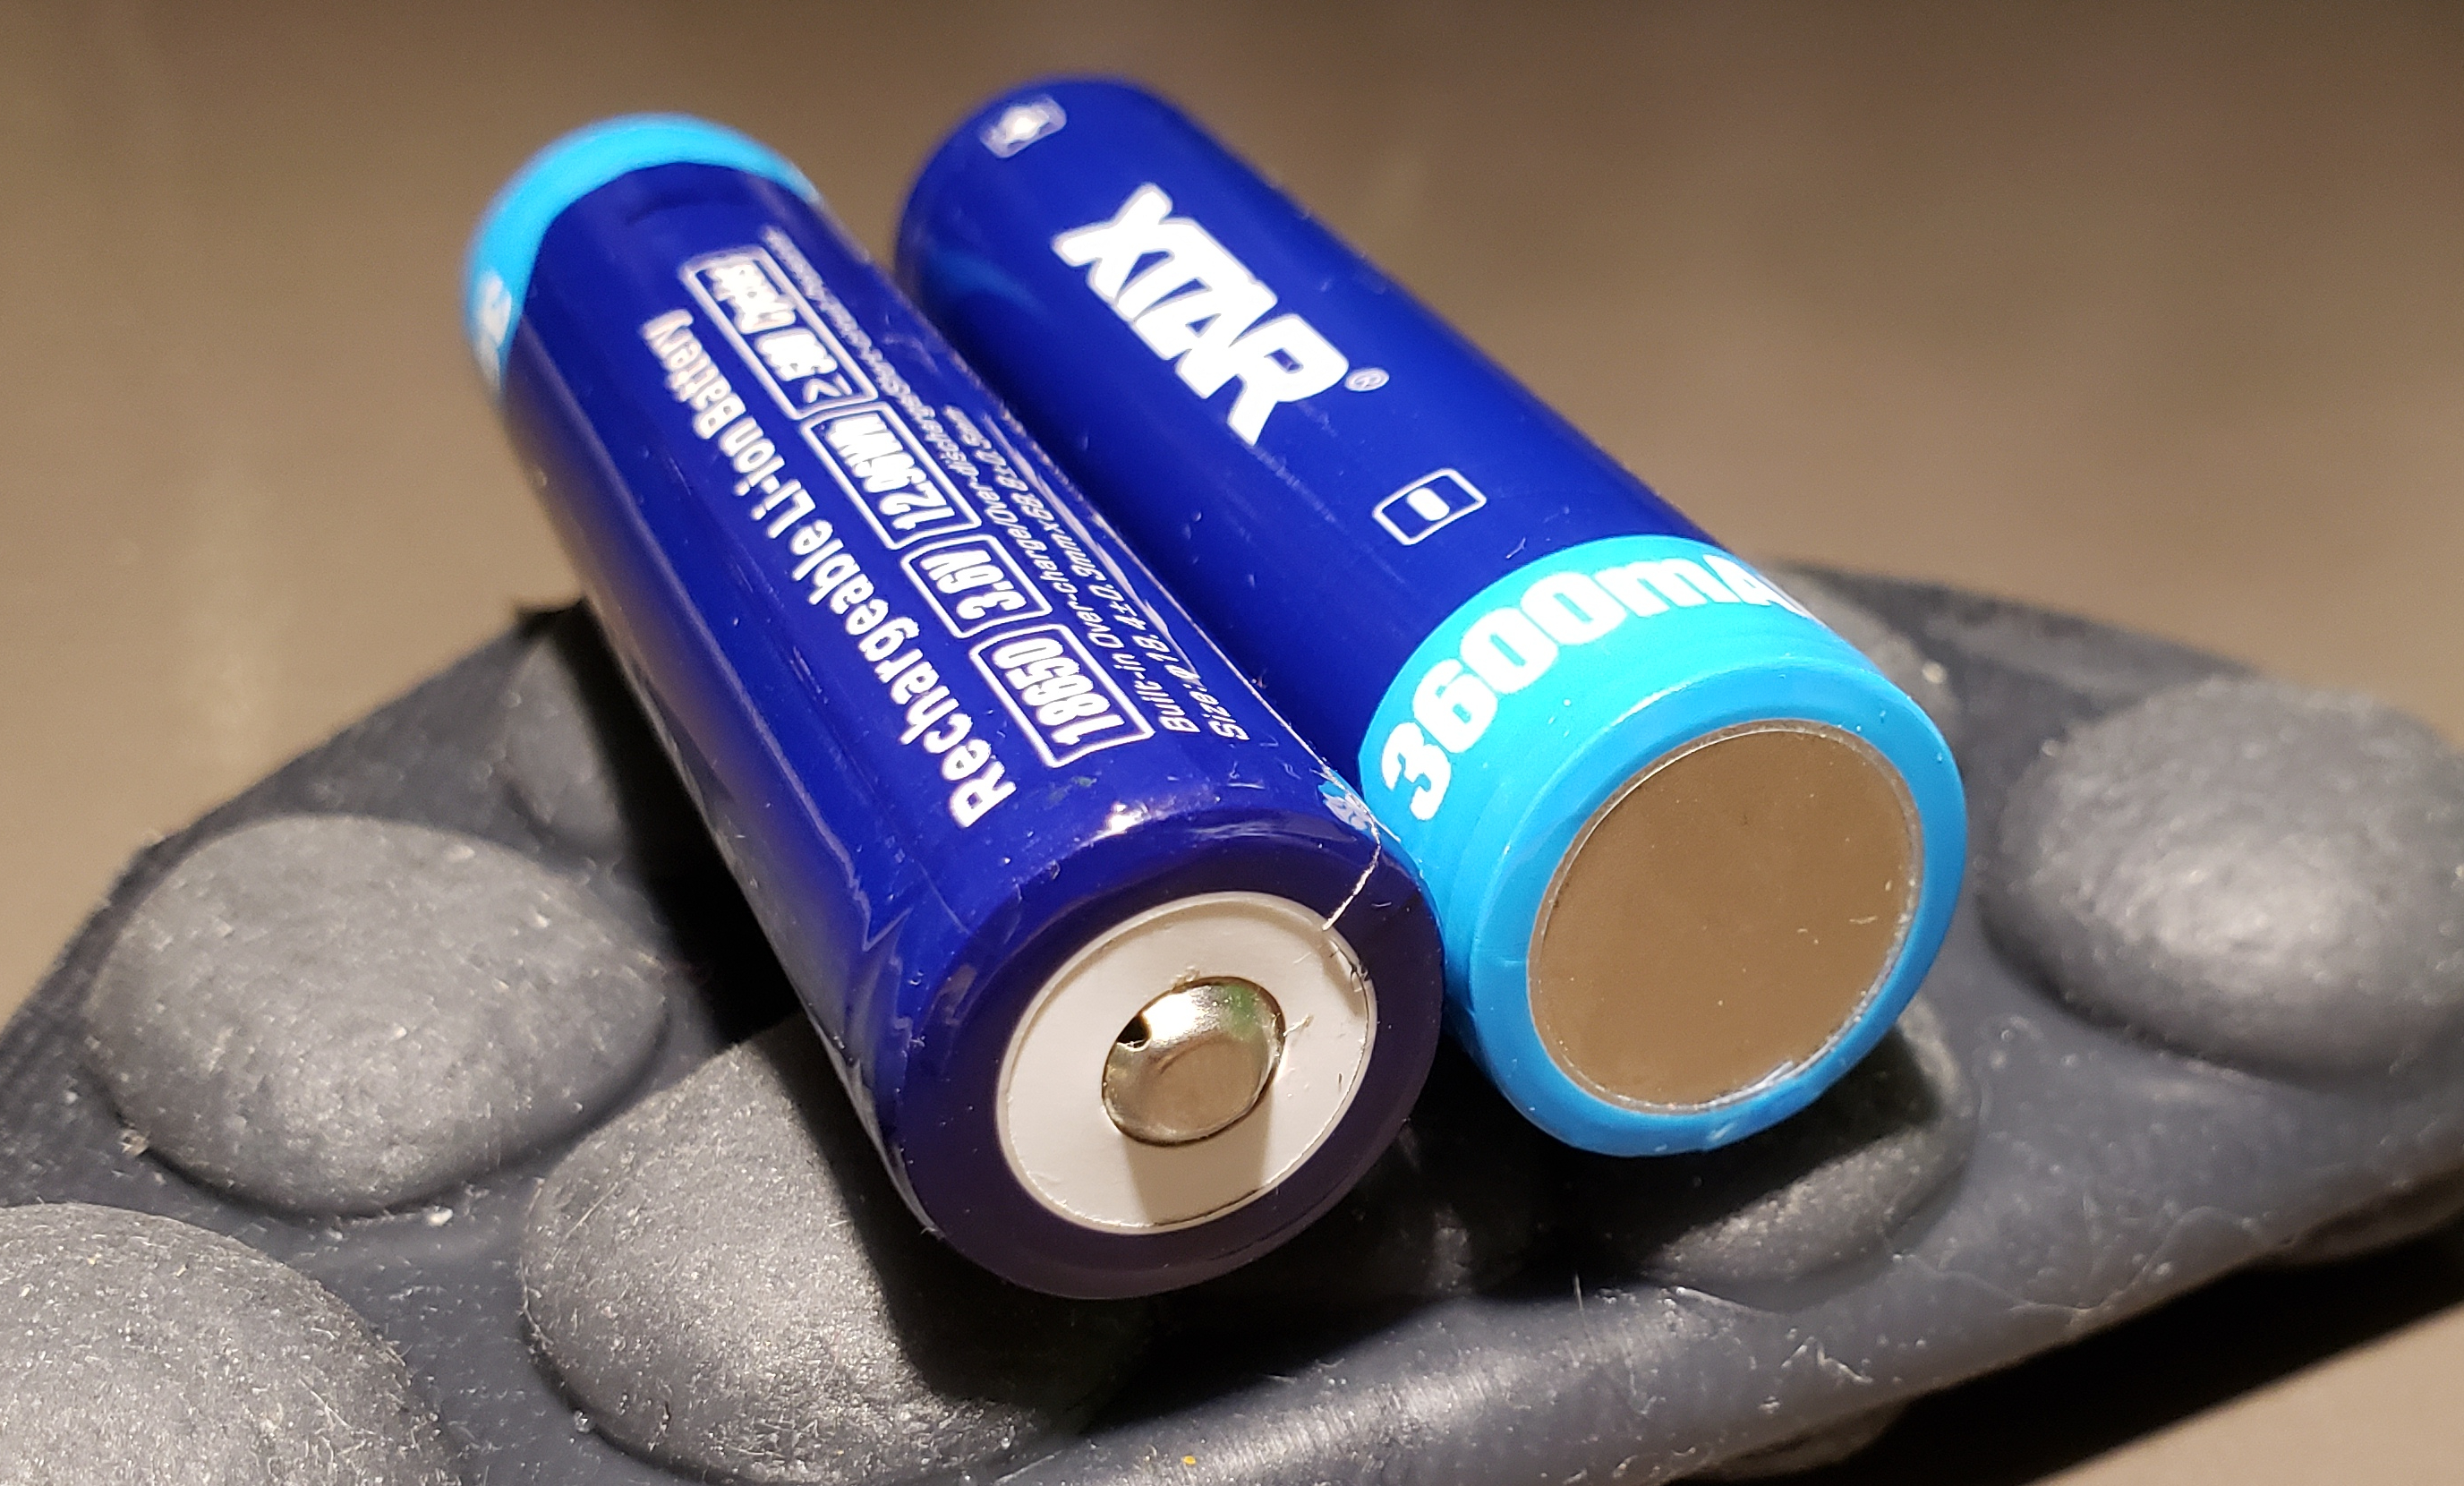
XTAR’s new 3600 mAh protected 18650 comes in a discreet box, holding nothing more than the battery itself. Like all protected 18650s, the protection comes in the form of a small PCB (printed circuit board) that is stacked on the negative end of the bare 18650 cell, with a metal strap running up the cell’s body to the positive terminal, where a small “button top” is attached to improve electrical connectivity for spring-loaded battery holders.

Positive and negative terminals of the XTAR 3600 mAh protected 18650 battery. Note the added length due to the button top on the left, and the protection circuit and protective plate on the right.
I was able to request an official datasheet for the battery, which I have included at the end of my blog post. My main goal with this review is to test the batteries from an objective perspective, using dedicated test equipment rather than in-application testing in devices like flashlights. If I do decide to perform such tests, I’ll add a second part to my review (stay tuned!).
Datasheet specifications
| Parameter | Value |
|---|---|
| Cell manufacturer | (Unspecified) |
| Nominal voltage | 3.6 V |
| Nominal capacity | 3600 mAh |
| Minimum capacity | 3500 mAh |
| Discharge cutoff voltage | 2.5 V |
| Cycle life @ 80% capacity | At least 300 times (0.5C charge to 4.2 V, 0.03C taper; 0.5C discharge to 2.5 V) |
| Size | 18.1~18.7 mm diameter 68.3~69.3 mm length |
| Weight | ≤50 g |
| Internal AC resistance | ≤45 mΩ |
| Standard charge | CC 720 mA CV 4.2 V Taper 50 mA |
| Fast charge | CC 2500 mA (0.7C) CV 4.2 V Taper 36 mA (0.01C) |
| Standard charge voltage | 4.2 V |
| Standard discharge | 720 mA CC to 2.5 V |
| Continuous discharge current | >8.5 A |
| Overvoltage protection | Trip 4.25~4.35 V Recover 4.0~4.2 V |
| Undervoltage protection | Trip 2.4~2.5 V Recover 2.8~3.0 V |
| Overcurrent protection | Trip 11~13 A |
| Working temperature | Charging: 0~45 °C Discharging -20~60 °C |
Test 1: EBL TC-X Pro battery analyzer
Initial testing of the batteries was tested using my EBL TC-X Pro 4-bay battery analyzer. The test procedure for the batteries was performed as follows:
- Record out-of-box/initial voltage before charging
- Run automatic capacity test with programmed 1500 mA charge current to 4.2 V, and fixed 500 mA discharge to 2.75 V (charge -> discharge -> charge); record discharge capacity and reported internal resistance
- Run manual discharge test with fixed 500 mA current to 2.75 V; record discharge capacity and reported internal resistance
- Run manual charge with 1500 mA charge current to 3.65V/LiFePO4 mode (moderate voltage is best for long-term storage); record charge capacity
| Parameter (charge current = 1.5A) | Cell 1 (bay 1) | Cell 2 (bay 2) |
|---|---|---|
| Initial voltage (V) | 3.65 | 3.55 |
| Capacity run 1 (mAh @ 2.75 V end of discharge) | 3349 | 3369 |
| Capacity run 2 (mAh @ 2.75 V end of discharge) | 3334 | 3386 |
| Internal resistance run 1 (mΩ) | 54.9 | 46.9 |
| Internal resistance run 2 (mΩ) | 53.4 | 45.1 |
| Storage capacity (mAh charged to 3.65 V) | 1402 | 1494 |
The capacity numbers seemed a bit low to me, even for an incomplete discharge to 2.75 volts instead of 2.5 volts. I decided to continue testing with a more accurate (and calibratable) battery fuel gauge board, revealing the true capacity of this battery… and it’s as good as the manufacturer promised!
Test 2: Texas Instruments bq78z100 fuel gauge
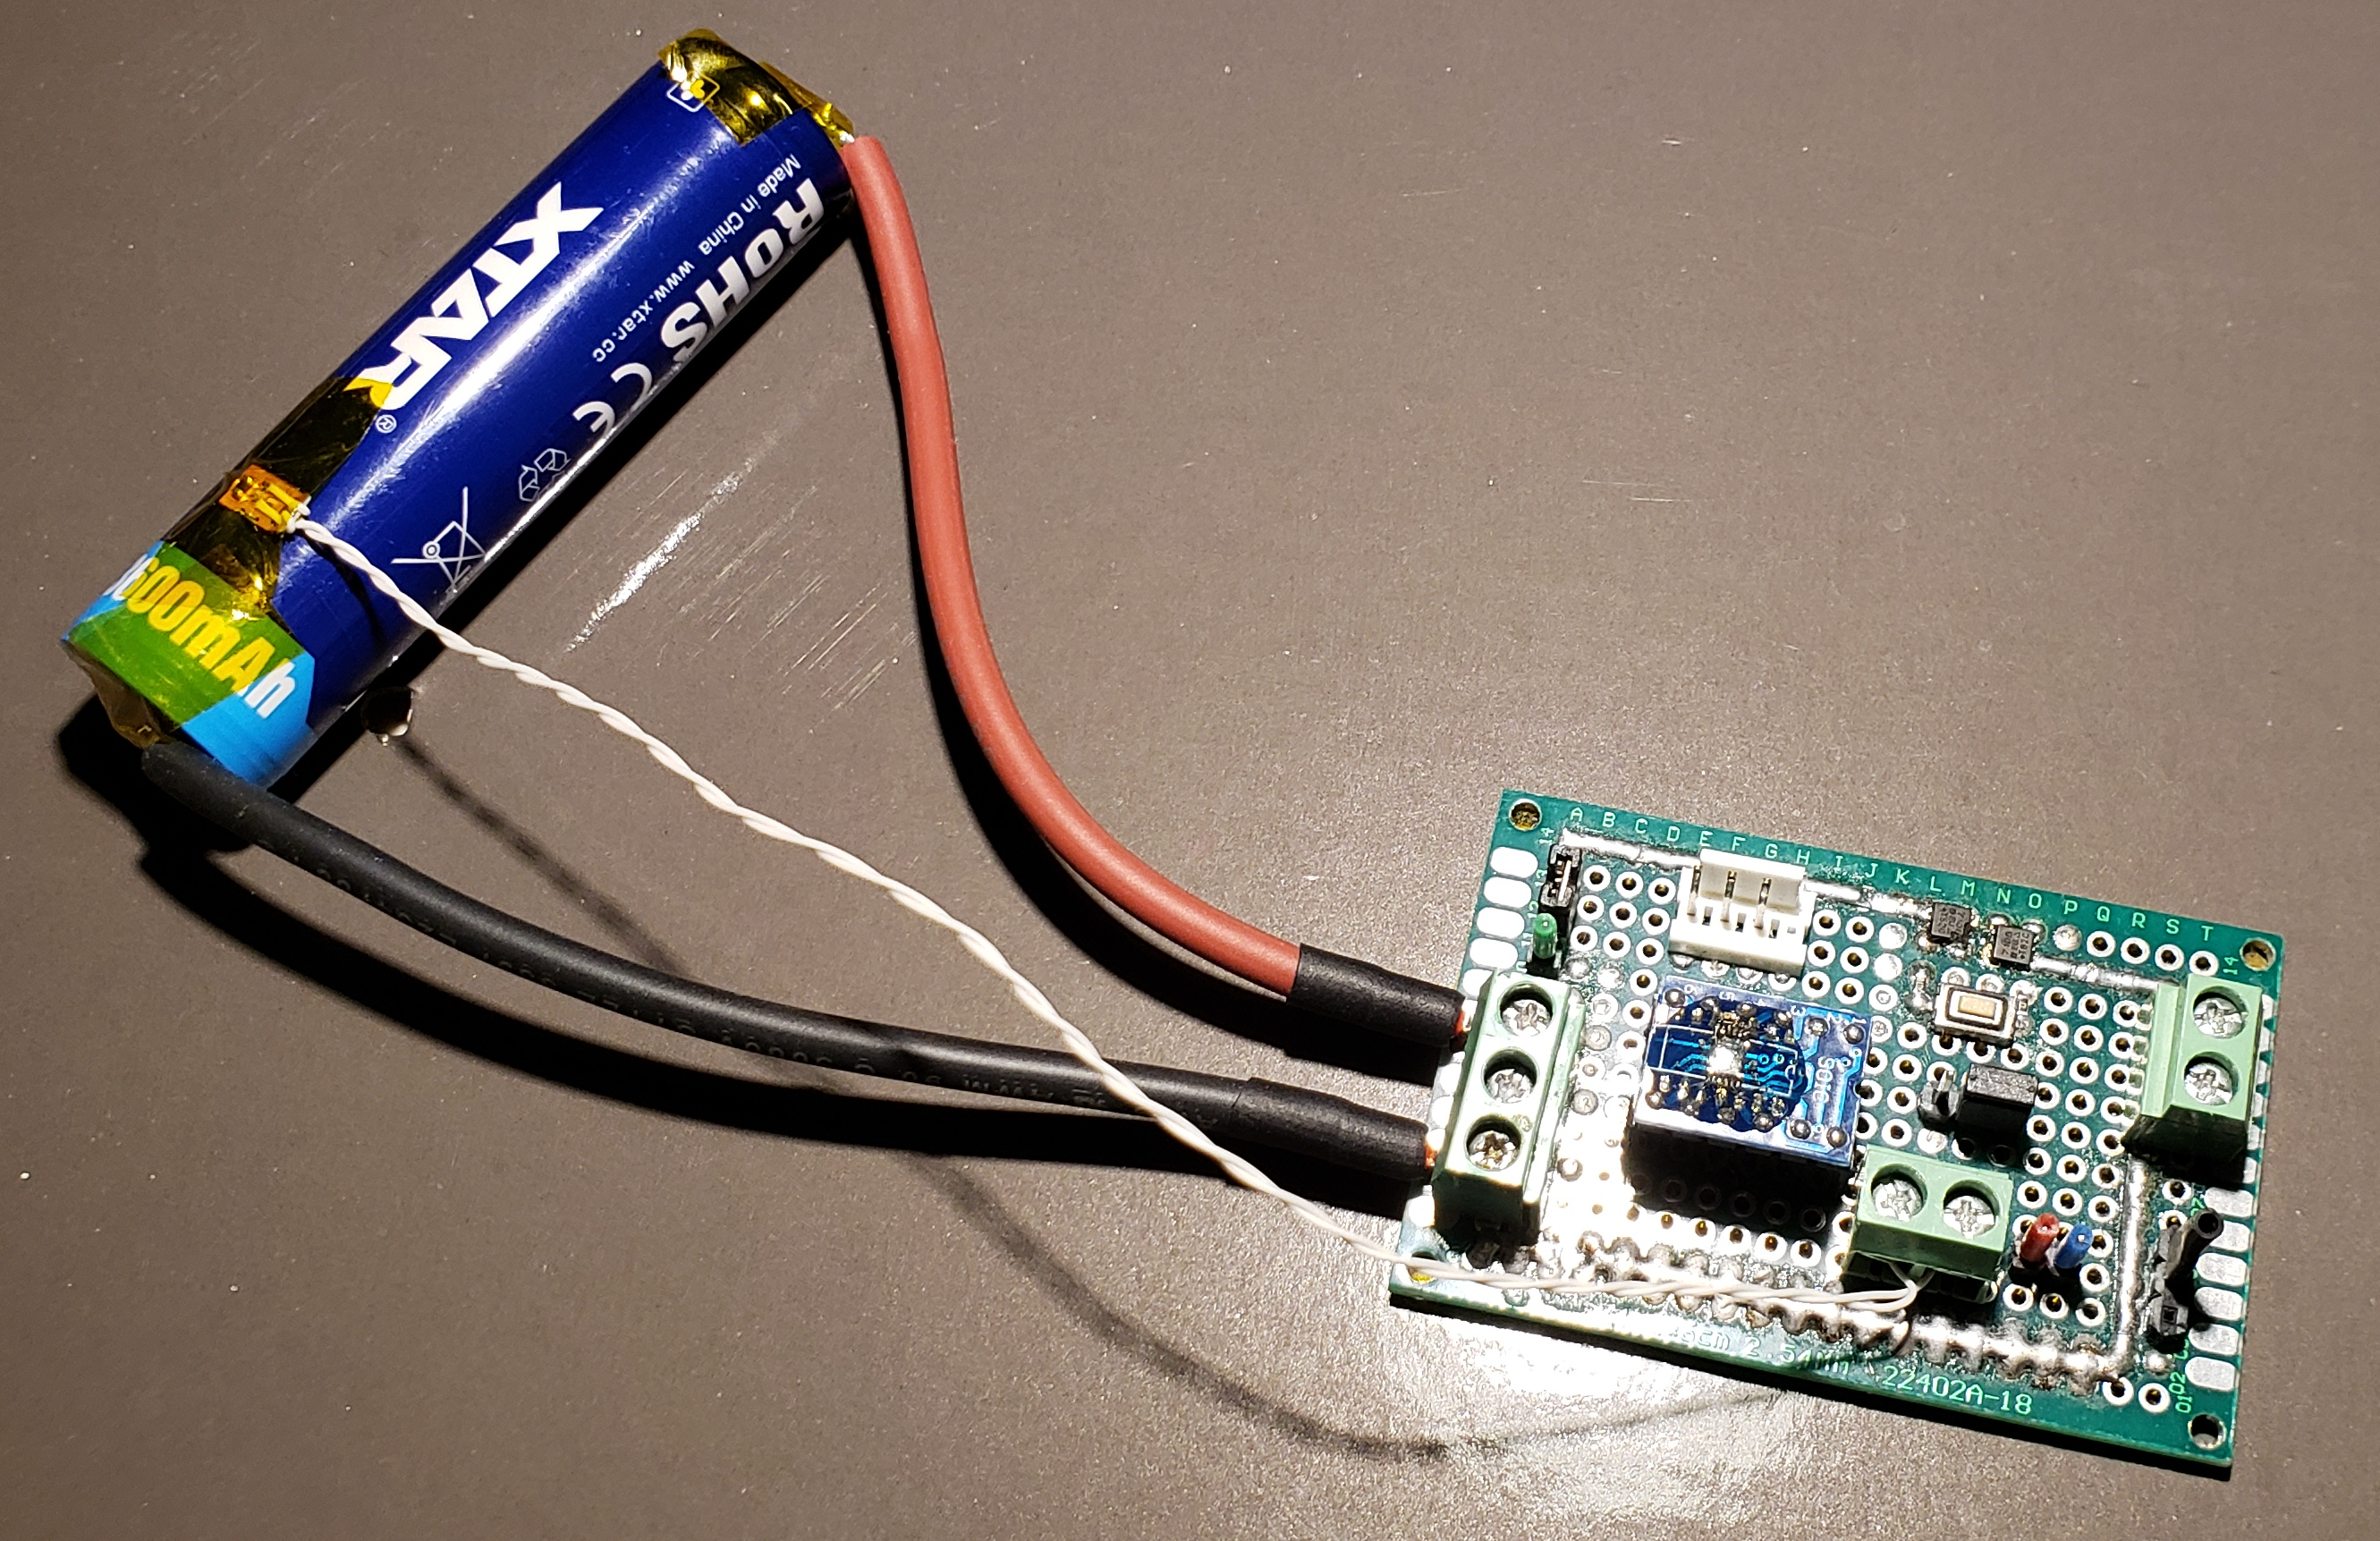
After realizing that my dedicated battery analyzer wasn’t quite as accurate as I wanted, I decided to use a battery fuel gauge board that I had more confidence in. I had previously built a board based on the Texas Instruments bq78z100, a dedicated battery management system (BMS) on a chip, aimed at 1S and 2S battery packs. This allowed me to calibrate the voltage and current measurements against my Agilent/Keysight U1253B multimeter and therefore get the most accurate results, as I can also program the bq78z100’s autonomous protection features to provide precise control over the discharge cutoff voltage during testing.

XTAR 3600 mAh protected 18650 battery connected to the bq78z100-based fuel gauge board. (note: actual setup is different than as pictured)
Using this circuit, I was able to get multiple measurements of the battery’s capacity with the help of a Texas Instruments GDK (Gauge Development Kit) as a charger and adjustable load for some of the capacity tests; and an Arachnid Labs re:load 2 adjustable constant-current load, with some additional forced-air cooling for the higher discharge rates.
I suspect that if I had a more, erm, “professional” setup, I could extract even more capacity from the battery, as additional resistance between the battery and the fuel gauge board will cause a voltage drop and subsequent loss in measured capacity.
Available capacity vs. end-of-discharge voltage
This is one of the most interesting test results, in my opinion. Many 1S/”single-cell” devices can’t take full advantage of modern NMC (nickel-manganese-cobalt) cells whose end-of-discharge voltage is below 3 volts, and the following chart helps quantify how much capacity can be extracted if one stops earlier than that. One advantage of reducing the depth of discharge, however, is that it can extend the battery’s cycle life and reduce the amount of capacity loss it experiences with age. As long as you discharge all the way to 2.5 volts and at a modest rate, the XTAR 3600 mAh battery achieves its rated capacity, and then some!

XTAR 3600 mAh protected 18650’s voltage/capacity curves at various discharge rates. (click here for full-size chart)
| Discharge Rate | Capacity/DoD@ 3.3V (Rel/Abs) |
Capacity/DoD @ 3.0V (Rel/Abs) |
Capacity/DoD @ 2.75V (Rel/Abs) |
Capacity/DoD @ 2.5V (Rel/Abs) |
|---|---|---|---|---|
| C/10 (350 mA) |
2616 mAh 72.4%/72.4% |
3357 mAh 92.9%/92.9% |
3539 mAh 97.8%/97.8% |
3613 mAh 100%/100% |
| C/5 (720 mA) |
2555 mAh (N/A)/70.7% |
3250 mAh (N/A)/90.0% |
(No Data) | (No Data) |
| C/2 (1800 mA) |
2310 mAh 67.2%/64.0% |
3076 mAh 89.4%/85.1% |
3338 mAh 97.1%/92.3% |
3438 mAh 100%/95.2% |
| 1C (3600 mA) |
1995 mAh 57.2%/55.2% |
2874 mAh 82.4%/79.5% |
3330 mAh 95.5%/92.2% |
3486 mAh 100%/96.5% |
Note that “relative” and “absolute” percentages correspond to the 2.5 volt discharge values for each row and the C/10 rate, respectively. The curve for the C/5 discharge rate ends early, as that data was collected with my Texas Instruments GDK (Gauge Development Kit), which has a hardcoded discharge cutoff at 2.9 volts. One oddity of the 1C curve is how it actually gets slightly more capacity than the C/2 rate; I suspect this is because the internal resistance of the battery was decreasing due to cell heating, allowing the lithium ions to travel across the cell’s separator more easily. Additionally, the capacity under-reporting issue I was having with the EBL tester is more visible in this chart, since a rough extrapolation would bring the discharge curve at 500 mA around 3550 mAh, which is a fair amount higher than the measured ~3340 mAh. If I have the time to recollect some data, I’ll add it to the chart.
Thermal performance
I don’t have the equipment to test beyond a 1C discharge rate, but even at a C/2 discharge rate I noticed significant heating of the battery; nothing disconcerting but still noteworthy. At 1C, the temperature rose to just over 40 degrees Celsius (104 degrees Fahrenheit) by the end of the discharge cycle – definitely warm to the touch but not burning hot. However, I imagine that a discharge rate at 2C or even higher will result in battery temperatures exceeding 50 degrees Celsius (122 degrees Fahrenheit), hot enough to be uncomfortable to hold. Note that lithium-ion batteries should not be charged if they are warmer than 45 degrees Celsius (113 degrees Fahrenheit).

XTAR 3600 mAh protected 18650’s temperature curves at various discharge rates. (click here for full-size chart)
Chemistry analysis
After running the data taken at a C/10 discharge rate through TI’s online tool, GPCCHEM, I was able to get two chemistry IDs that would allow me to get an accurate model of the cells for use in their Impedance Track line of fuel gauges.
| Chemistry ID (hex) | Chemistry Description | Cell match | Max DoD error (%) | Max Ra deviation ratio |
|---|---|---|---|---|
| 5267 | LiMn2O4 (Co,Ni)/carbon, 4.2 V | Bak: N18650CP (3350 mAh) | 2.3 | 0.27 |
| 5634 | LiMn2O4 (Co,Ni)/carbon, 4.2 V | NanoGraf: INR-18650-M38A (3800 mAh) | 2.72 | 0.61 |
Don’t pay too much attention to the details; they are provided for informational purposes only and mainly of use for those that want to use these batteries with TI’s fuel gauge chips. The specific models listed are not a guarantee that these batteries actually are that cell model, but it does confirm that our data is otherwise trustworthy; both listed models are high-capacity cells and use a chemistry system containing nickel, manganese, and cobalt (NMC for short), and such chemistries tend to have a relatively high capacity at the expense of lower terminal voltage (3.6 V nominal, 2.5 V at end of discharge; versus the typical 3.7 V nominal and 3.0 V end of discharge).
Conclusion
After my testing, I can confidently say that XTAR’s 3600 mAh 18650 really does achieve its rated capacity. As long as your target device is capable of discharging to 2.5 volts and at a modest rate, it will be able to get the most out of this battery.
If you want to purchase this battery, you can do so from their online store: https://xtardirect.com/products/18650-3600mah-battery?VariantsId=10393
At the time of writing, XTAR is selling this battery at $11.90 USD for a single battery, or $23.80 USD for a two-pack with carrying case.
Downloads
The datasheet for the battery can be found here: https://www.dropbox.com/s/wibdm2ty6zfa7xo/XTAR%2018650%203600mAh%20Specification.pdf?dl=1